Reversal Patterns: How to Detect a Change in Trend Direction?
Author : Maks Artemov

Imagine a distinct uptrend that has long been in the market. How do we know when it is over? Or, if a descending dynamics last long, how do we know where it reverses? These are the questions that many traders are perplexed by.
There is no unique answer to this question. The trend may reverse at any time, so the trader's task is to detect the time and place. There are lots of theories, practices, indicators, and other ways of market analysis meant for this.
Today, I will speak about a classical method of detecting a trend reversal. Watching the charts, market players have come to certain conclusions about the laws of price movements. At specific moments, the impulse comes to an end, and the trend changes its direction. Let us have a look at a group of reversal patterns, which are likely to precede a trend reversal.
What patterns do we look for?
Before speaking about reversal patterns, a small remark: candlestick patterns may have different names in different strategies and translations; moreover, they may differ slightly in appearance, however, their essence remains the same.
The main candlestick patterns at the top of the trend would be: 
Hanging Man
.
In essence, it is an inverted Shooting Star. The upper shadow is minimal or lacking, the body looks small, the lower shadow looks rather long. The Hanging Man is similar to the Hammer.
Doji
These candlesticks may form at any place of the chart and still have the name Doji. Other candlesticks are different, and we will discuss them later on.
A Doji looks like a cross or a "+". This means it has tiny shadows, and its body looks like a line because the opening and closing prices are on one line. Some Dojis have two long shadows and are called Legged Dojis; however, the signal they give is the same.
Reversal patterns at the bottom of the trend
Now - to the reversal patterns at the bottom of the trend. I should make it clear that the candlestick patterns themselves may look absolutely identical to those that form at the peak of the trend; however, they have different names. The work off is also the same: a trend reversal.
Hammer
It looks like the Hanging Man: a small body, a small or lacking upper shadow, and a long lower shadow. The only difference is that the pattern forms at the bottom of the trend.
Inverted Hammer
It is similar to the Shooting Star: a long upper shadow, a small body, and an almost lacking lower shadow. Like the Hammer, it forms at the bottom of the trend.
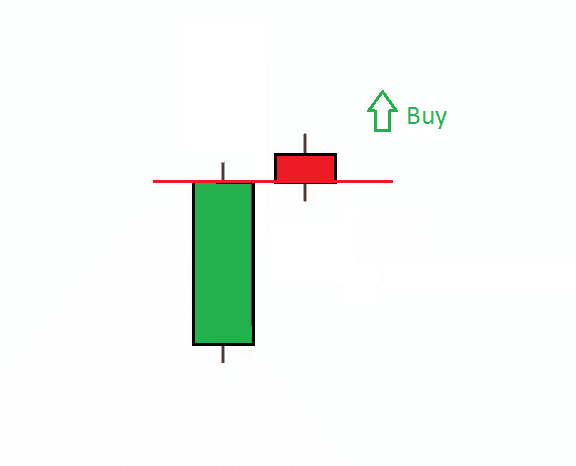
Engulfing
It consists of two candlesticks. The first descending bar has a short body, the second one is visually larger, and its body covers up the projection of the first pattern.
Read more at R Blog - RoboForex
Sincerely,
RoboForex team
Author : Maks Artemov
Attached Image (click to enlarge)
Dear Clients and Partners,
Imagine a distinct uptrend that has long been in the market. How do we know when it is over? Or, if a descending dynamics last long, how do we know where it reverses? These are the questions that many traders are perplexed by.
There is no unique answer to this question. The trend may reverse at any time, so the trader's task is to detect the time and place. There are lots of theories, practices, indicators, and other ways of market analysis meant for this.
Today, I will speak about a classical method of detecting a trend reversal. Watching the charts, market players have come to certain conclusions about the laws of price movements. At specific moments, the impulse comes to an end, and the trend changes its direction. Let us have a look at a group of reversal patterns, which are likely to precede a trend reversal.
What patterns do we look for?
Before speaking about reversal patterns, a small remark: candlestick patterns may have different names in different strategies and translations; moreover, they may differ slightly in appearance, however, their essence remains the same.
The main candlestick patterns at the top of the trend would be:
- Shooting Star
- Hanging Man
- Doji
- Gravestone Doji
- Harami
- Engulfing
Reversal patterns at the top of the trend
One condition, common for all reversal patterns, is the presence of a strong support or resistance level and a long-term trend.
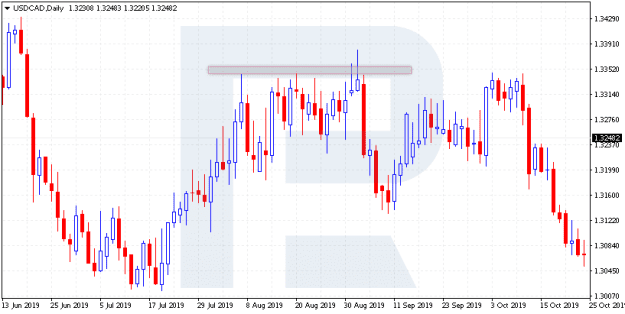
Shooting Star
It looks like a candlestick with a small body and a very long upper shadow. It normally forms after the abrupt growth of the quotations. The lower shadow, in this case, will be short. Ideally, the body of the candlestick and the impulse have opposite colors (after a row of growing candlesticks, the Shooting Star is a descending one).
Attached Image (click to enlarge)
Hanging Man
.
In essence, it is an inverted Shooting Star. The upper shadow is minimal or lacking, the body looks small, the lower shadow looks rather long. The Hanging Man is similar to the Hammer.
Doji
These candlesticks may form at any place of the chart and still have the name Doji. Other candlesticks are different, and we will discuss them later on.
A Doji looks like a cross or a "+". This means it has tiny shadows, and its body looks like a line because the opening and closing prices are on one line. Some Dojis have two long shadows and are called Legged Dojis; however, the signal they give is the same.
Reversal patterns at the bottom of the trend
Now - to the reversal patterns at the bottom of the trend. I should make it clear that the candlestick patterns themselves may look absolutely identical to those that form at the peak of the trend; however, they have different names. The work off is also the same: a trend reversal.
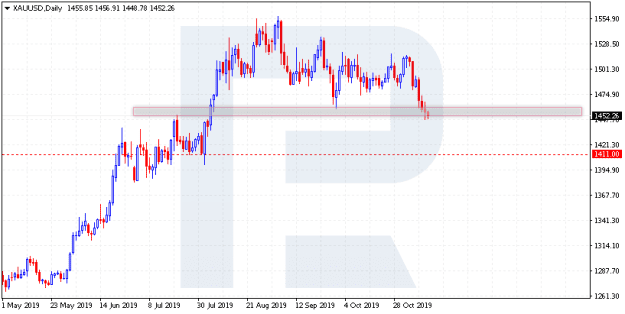
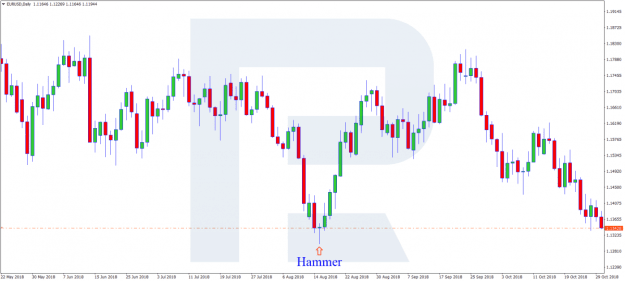
Hammer
It looks like the Hanging Man: a small body, a small or lacking upper shadow, and a long lower shadow. The only difference is that the pattern forms at the bottom of the trend.
Attached Image (click to enlarge)
Inverted Hammer
It is similar to the Shooting Star: a long upper shadow, a small body, and an almost lacking lower shadow. Like the Hammer, it forms at the bottom of the trend.
Engulfing
It consists of two candlesticks. The first descending bar has a short body, the second one is visually larger, and its body covers up the projection of the first pattern.
Read more at R Blog - RoboForex
Sincerely,
RoboForex team