DislikedThanks for this Obaidah, one look at the code, and I can see that you put a lot of thought into this, way more than I would have , lol. I Believe its well worth your efforts....Ignored
please try to check the calculations of close part which is in "Spread Analyzer" indicator because i feel like there's something wrong,
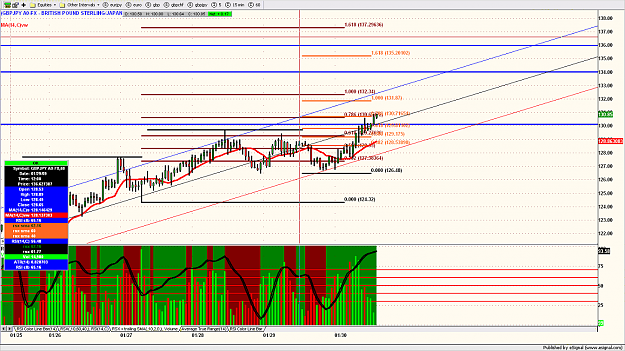
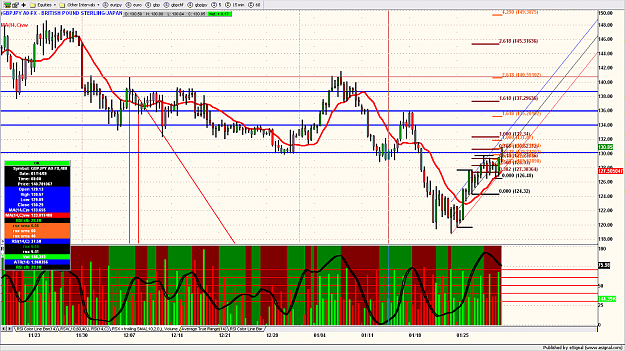
about the colors, orange volume histograms below the blue line represent low volumes, above the orange line represent high volume, red histograms represent very high volume and violateblue represent ultra high volume.
I recommend you read something else as this sentence is now concluded.