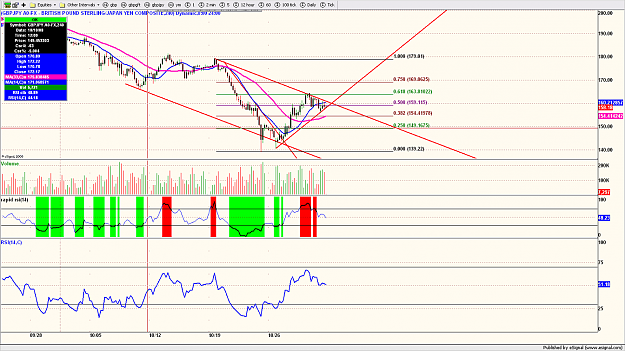
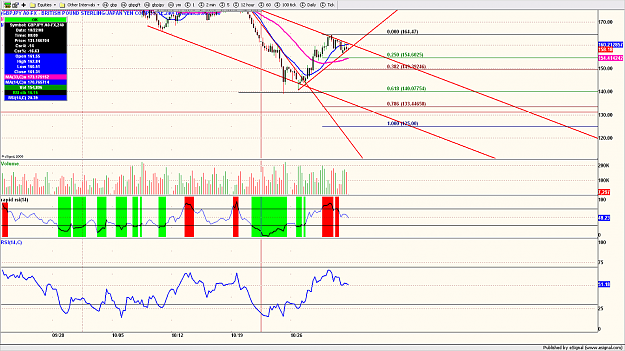
The following are weekly, daily and H4 gbpjpy charts, one thing worth to mention on weekly chart which is that we have what looks like a broken falling wedge on CCI30, i know not how reliable failing wedges on oscillators are but i know that its something to keep in mind, however, on daily chart, oscillators are showing soft bearish HD along with H4 chart showing strong bearish HD combined with market being in progress to complete the 5th wave, i have no idea at all whether if its going to be a truncated or an implusive wave, but what i know is that there's a high probability of having stocks sell-off on Monday, however, a close below H4 CCI30 trendline and the divergance might start playing.
the monthly candle looks like those we have in the end of a trend but im not going further to predict if a reversal is near or not, i'll start looking for clues once i see the market reaction after the elections.
i'd like to hear your comments guys
the monthly candle looks like those we have in the end of a trend but im not going further to predict if a reversal is near or not, i'll start looking for clues once i see the market reaction after the elections.
i'd like to hear your comments guys
Attached Images


I recommend you read something else as this sentence is now concluded.