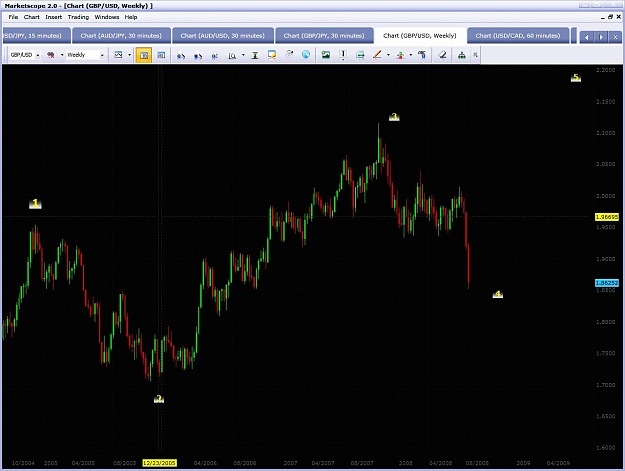
what we have on the weekly cable chart is a complex h/s formation with a broken neckline. a MAJOR change of trend which i believe will reach 1.72x before the end of the year
i had expected 2 weeks ago that we might bounce off 1.90x area, but we didnt, which displays the strength of the trend reversal.
welcome to the era of dollar strength fellas
Ignored
...interesting, well we'll have to see how it reacts at the weekly chart 23.6 fib then, about where your neck line is. Indications are it should retrace to at least that level.
...interesting, well we'll have to see how it reacts at the weekly chart 23.6 fib then, about where your neck line is. Indications are it should retrace to at least that level.
Ignored
i'm sure we'll see 1.70x in the next weeks/months.
however, i'm not sure if drew that neckline correctly... it may be drawn from other bottoms.
...interesting, well we'll have to see how it reacts at the weekly chart 23.6 fib then, about where your neck line is. Indications are it should retrace to at least that level.
Ignored
which RSI settings are u using godfrey? open, close, or typical price?
Since, you're here, what's your take on the gbp/chf. I see a flag on the weekly.
Ignored
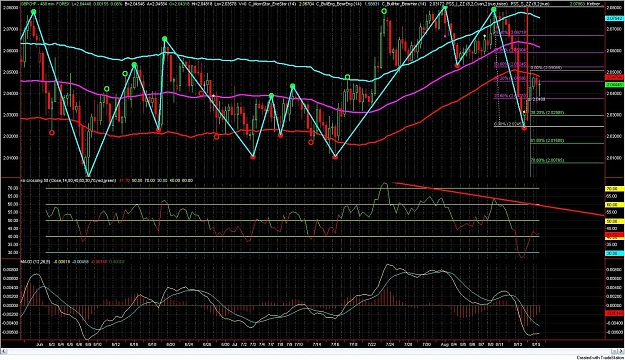
Here is the 8 hour chart of gbpchf
As we know in strong down trends we should not retrace more than the 38.2% fib retracement.
Once that 2.0400 level gives way we will be seeing that 1-2-3 fib expansion play out down to 2.0070 , this will be the bounce zone , as the 78.6 fe typically is.
Then maybe a slight retracement to 2,0170 / 2.0235 (which would be the 38.2 % fib retrace of the move 2.0485 to 2.0070
from 2.0230 area all way down to 138 % fib extension at 1.9750
OR ... lol .... it could straight to 4.0000 from here
Ignored
, I know I'll be giving up several potential pips, but I have realized that my best trades are usually when the 4hr gann is in the direction of my trade. So I'll probably wait until the 4hr gann flips before I re-enter a short.
, I know I'll be giving up several potential pips, but I have realized that my best trades are usually when the 4hr gann is in the direction of my trade. So I'll probably wait until the 4hr gann flips before I re-enter a short.
Ignored
2.0375 is my short entry . ...targets 2.0335 and then 2.0250. Once the 2nd target is hit I will move stop down to 1st target.
Since, you're here, what's your take on the gbp/chf. I see a flag on the weekly.
Ignored
the blue shaded area was my call a couple of weeks ago on a short because of a double top. it did play out well for me, only i was targeting the red TL (didn't want to say that, because malcomb was about to go off on me, loool). but we did reach that TL after price made a triple top and that's when i made another call on a possible good long for gbp/chf.
i think we both agree that it's time for cable to retrace upwards.... the only thing i'm not sure of is to where it should retrace. but my best guess would be that neckline i posted earlier (23.6 fib).
usd/chf is a good short at the moment with daily FE 100 reached and a weekly 38.2 fibo closely reached (but not fully). i'm expecting it to retrace to 1.078x or even 1.061x, If not reversing completely and calling it a "Resumption of major trend" time. however, another move up is not impossible for a full 38.2 retracement. dailies are overbought bigtime, and price very far away from weekly 5sma. guess what, price is touching monthly gann; and with dailies overbought, this confirms a possible good short.
i think the latest 4h gbp/chf retracement was triggered by usd/chf's rally after breaking it's bullish flag.
this puts me in suspicion about another big move for gbp/chf. because we're going to have wait and see which is going to move "Faster" from the 2 pairs mentioned above.
now if i'm to take gbp/chf as a separate pair and analyze it alone, i would say the following scenario(s):
- triple top + bearish divergence still in play: another leg down to 23.6 at 2.0235 since there's no bullish divergence visible. i also believe there's another move down from the shape of CCI, u'll know what i mean when u spend more days watching how CCI draws itself before a move.
- here comes the tricky part: if u take a look at my fibs, u'd noticed the bounce was from 127.2,,,, and u prolly know how many time i've bugged u guys about this; reaching 161.8 is NOT impossible. it would be so in the short term IF and only IF 23.6% fib is taken out, otherwise our short/mid term target is 2.1, and guess what, that value is may's high. on the other hand, a bounce from 127.2 is a VERY good reversal indication for me: and performing a triple top there couldn't be a better signal of reversal. HOWEVER again, we need 23.6 to be taken out first for a complete reversal, and luckily the picture is simpler because i have TL there, which makes perfect sense.
- you know, this entire thing is making me nuts. i'm not sure if usd/chf would go down fast, BUT, it HAS made a weekly 38.2 retracement (or close?). will it retest that area after making a retracement downwards triggering a rally for gbp/chf?? or will cable make that rally? who knows?!?!
|
Additional Username
|
Joined Aug 2007
|145 Posts
the euro looks stronger to me than the GBP....so i would prefer short for gbpchf...will look good when compared alongside the call for short of GBPjpy as well....2.0460 seems tough to crack and 2.0800 looks even tougher...i mean , just look at how many times it tried to crack 2.08 and failed over the past mnth...
the euro looks stronger to me than the GBP....so i would prefer short for gbpchf...will look good when compared alongside the call for short of GBPjpy as well....2.0460 seems tough to crack and 2.0800 looks even tougher...i mean , just look at how many times it tried to crack 2.08 and failed over the past mnth...
Ignored
gbpchf 10 min
look how that 38.2 fib retracement is forming resistance ,coupled with a downward trend line on the rsi.
If we break the 50 sma on the 10 min at asia open today I am going to take her for a day trade short into 2.0380 zone
If we break out of 38.2 fib I am going to take her for a day trade long into 50% fib retrace at 2.0450 ish. On the breakout of the 38.21% fib I have to see the trends line on that rsi getting broken to other wise it is a false breakout .
Joined Apr 2007
|
Status: HARD SHYT SCUBA TRADER
|20,883 Posts
Here is 60 min chart
we are right above the 23.6 fib retracement with a bear flag formation.
I think she looks like she wants to test that 38.2 level at 207.66 . That is a good intermediate target AS LONG AS THE 50 SMA ON THE 60 MIN HOLDS AT 205.
The level of 207.60 is also the 161.8 % fib extensions of the 1-2-3 buy off the bottom
1. We are in Bearish Trend (Weekly, Daily Gann crossed over)
2. We are in retrace mode.. 2 corrective waves on 4H A and B, and now chasing wave C. We stopped on 0,618 FiboExtensions @ 206.49
3. Targets I am looking (FROM 206.49, UP TO: -> ideally FE 100 @ 207.76 -> lot of confluence there: 50ema[4H],Upper chanel Line, 100sma[Daily], but can extend up to 209.83 or more.)
4. Look @ all Impulsive waves from 251.1; They all RETRACED at least 0.61to 0.786 FIBO before continuation of the FALL.
5. Break of 204.40 where the corrective wave B is, for me is a signal for activation of more SHORTS + there is GANN [4H]
Until then: Scalping in range from 205.20 -> 207.70 (Bulls/Bears)
6. My indicators: [CCI 72, and RSI 72, with average of 50 ema]
lol thanks. now u know what kind of stuff goes on in my head before i make a trade on any given pair.
at the moment, usd/chf and cable look easier to trade than gbp/chf.
you'd probably know what gbp/chf will do or at least have a good idea, but trust me, it can DO something "unexpected" before going with u on a trade. HOWEVER, using a nice crossing system on lower TFs would make u a bunch of pips IF u have the time to invest on that sucker alone. for me, i swing trade most of the time, but i prefer scalping using my system on YM lately.
i'm an intraday/swing trader who HATES scalping ranges, loool. if i'm to scalp i wait for my system's confirmation for a swing, and trade or the longs/shorts that GO in the same direction of my confirmed direction on smaller TFs (ie: m5).
1. We are in Bearish Trend (Weekly, Daily Gann crossed over)
2. We are in retrace mode.. 2 corrective waves on 4H A and B, and now chasing wave C. We stopped on 0,618 FiboExtensions @ 206.49
3. Targets I am looking (FROM 206.49, UP TO: -> ideally FE 100 @ 207.76 -> lot of confluence there: 50ema[4H],Upper chanel Line, 100sma[Daily], but can extend up to 209.83 or more.)
4. Look @ all Impulsive waves from 251.1; They all RETRACED at least 0.61to 0.786 FIBO before continuation of the FALL.
5. Break of 204.40 where the corrective wave B is, for me is a signal for activation of more SHORTS + there is GANN [4H]
Until then: Scalping in range from 205.20 -> 207.70 (Bulls/Bears)
6. My indicators: [CCI 72, and RSI 72, with average of 50 ema]