DislikedDave,
I am curious as to what you see on the daily, weekly, and monthly charts that looks bullish. If you could post a chart and explain it would be helpful. Thanks.
M2BIgnored
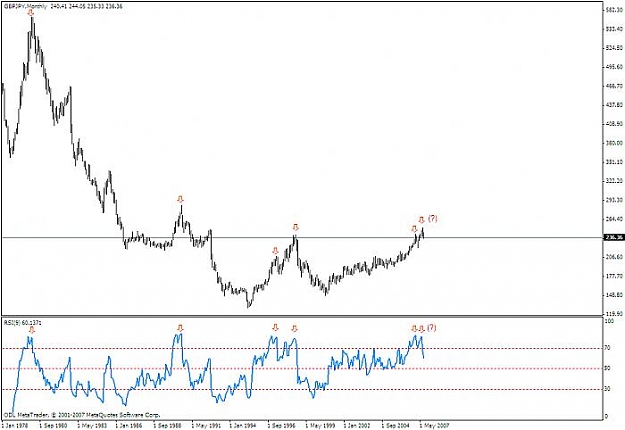
I always run with the main trend and you can see that the trend is up, ask a child which way the charts run!
If the daily candle closes above 235.09 this will be a very good sign that the long term trend will be resumed. Look back over the years.. its as clear as day and night
On the flip side can anyone show me that this pair has reversed to a downward trend? I'm not talking a few days or weeks here!
Regards
Dave