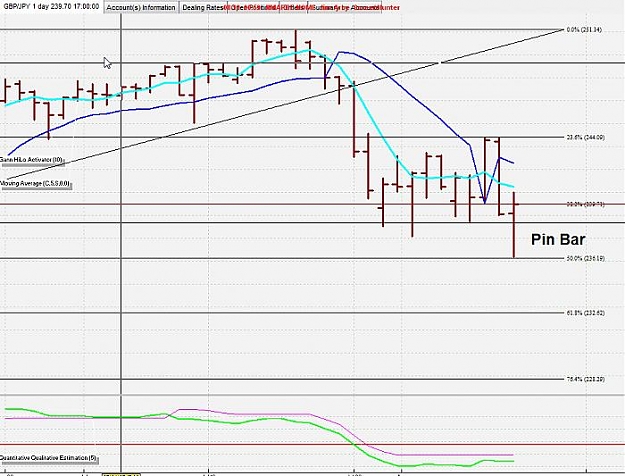
Heavy S/R at 239.60ish level & 38.2. 150 ema acting as support. 50.0 fib bounce. Should be an interesting week.
Jim
Ignored
Forgot to mention the all important Pin Bar on the GBPJPY Daily. A break above 240.30-50 and we are going up, up ,up. (with a SI conformation of course)
Attached Image (click to enlarge)
Indicators show the past. Price Action "Indicates" the future.
Looks like the stage is set for a good buy position as 4 hr chart is bullish and and on 1 hr chart SI has touched 50 line also candles have formed above TFT line and 5sma is above current market if on next bar in 1 hr chart it continues to move up should we take buy position .If i am wrong somewhere plz correct me coz its what i have learnt so far of this trading technique.
I think we will go up to about 243.00, I have very strong resistance there (38.2%, trendline, resistance level) and then continue downwards..
BUT, if we get a convincing break and a close above the trendline, things will be different then..
Ignored
Karmo, thanks for the fibonnacci video link.
I'm trying to learn the very basics of fibonacci...one question: when you quote on this thread that we have / will reach X fibonacci level at Y price (and everyone else seems to see that same information themselves), you are presumably measuring the fib level from one certain place to another place on the chart, are you?
To explain: in the video you linked to, the instructor was giving examples of measuring the fib level from location X to location Y. You presumably do this also, right? But if that is true, then how come everyone on the thread seems to agree on the fib levels? Does that mean that they are all measuring from / to the same X and Y points?
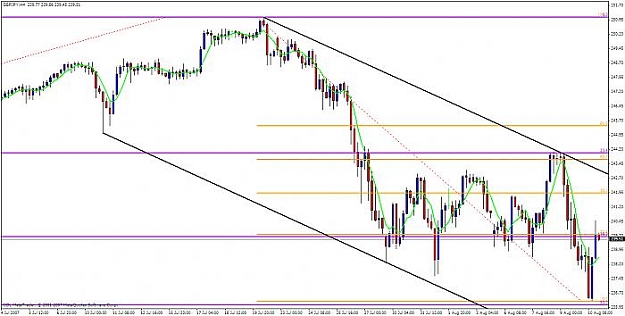
After hours and hours of thinking and analyzing this crazy pair, I think we are in downtrend for the short-term, but uptrend in the long-term..
First of all on my 4H chart, we are in a nice downtrend channel. After we made the low of 237.58 on 1st of August, retracement started, price retraced close to the 50.0% as you can see in the chart, on the 10th of August which is yesterday GJ made a new low, which tells me we are going to continue the downtrend.
Price looks like to be heading back to the upper trendline + 38.2%, we will have to wait and see but I believe we are in a downtrend and we are heading towards 232.50 (138.2% Fibo) area..
I was curious as to why you drew your Fib down to the 237.70 area and not all the way down to the 236.30 area. It doesn't affect the channel line but it does move the 38.2 Fib down from the 243 area to the 242 area. There is actually resistance at both of those levels. I was just trying to find out your reasoning on this because I don't want to be overlooking something and I know that you are an avid chartist and Fib man. Thanks.
GJ failed to cross over Fibo 50% few times since last week and i think GJ will test Fibo 38.2% first before continue to go down. Please correct if i am wrong>>
Currently GBP/jpy rate is 238.753..yesterday it was around 237.80......i think it will open below 238.00..go all the way down to 236.80 to 237.10.. before retracing back to 240-241 area.....i may be baised towards bearish because i still have my short open....
I'm trying to learn the very basics of fibonacci...one question: when you quote on this thread that we have / will reach X fibonacci level at Y price (and everyone else seems to see that same information themselves), you are presumably measuring the fib level from one certain place to another place on the chart, are you? Yes, that is correct, fibonacci retracement basically measures how much will a price retrace/pullback after it has gone strongly in a particular direction. It could be confusing to look at different timeframes, but it is very important because every trend is within another bigger trend.
To explain: in the video you linked to, the instructor was giving examples of measuring the fib level from location X to location Y. You presumably do this also, right? But if that is true, then how come everyone on the thread seems to agree on the fib levels? Does that mean that they are all measuring from / to the same X and Y points? Yes I do the same thing the instructor was doing. No, not everyone will be measuring the same levels, people ofcourse will draw their fibo's sometimes differently, and again it depends on the timeframe and on the pair that is being traded, every pair responds differently to fibonacci retracement levels. Read/listen on whatever material you can get about Fibo's and then apply them on your charts and see how a particular pair responded to it, try GU.
I was curious as to why you drew your Fib down to the 237.70 area and not all the way down to the 236.30 area. It doesn't affect the channel line but it does move the 38.2 Fib down from the 243 area to the 242 area. There is actually resistance at both of those levels. I was just trying to find out your reasoning on this because I don't want to be overlooking something and I know that you are an avid chartist and Fib man. Thanks.
M2B
Ignored
Ok, after looking at the chart again.. I drew it differently again, fibonacci retracement should be drawn from the top/bottom till the trend is exhausted and starting to retrace, from the top of 251.07 to 238.28, and then the price started to retrace, come back, retrace, come back, and it's retracing now again (ranging the past week between 0.00% and 38.2%), here's a chart to show you.. there are 2 fib's drawn, a daily one (blue) and a 4H one (pink)
Red lines - Resistance, Green lines - Support, for anybody wondering..
Silly question, I guess - but I'm assuming that the two dotted lines represent the two period(s) of time which form the basis for the two different fib levels, right?
Silly question, I guess - but I'm assuming that the two dotted lines represent the two period(s) of time which form the basis for the two different fib levels, right?
Looks like the stage is set for a good buy position as 4 hr chart is bullish and and on 1 hr chart SI has touched 50 line also candles have formed above TFT line and 5sma is above current market if on next bar in 1 hr chart it continues to move up should we take buy position .If i am wrong somewhere plz correct me coz its what i have learnt so far of this trading technique.
Ignored
HI mansa
as i am looking at the vt charts right now---this is offline version so i am unsure my charts are accurate--- i am seeing bearish Si at 1h,4h and daily. i suspect after we close weekend gap and should the 1h sma cross above the 50 and then back below, it will be time for a short given the 4h remains bearish. 4h si needs to be up(and i think above the 50?) to be bullish.
hopefully aus can confirm this, or correct me if i am not seeing this correctly