I think Karmostaji went to do something fun, not sit glued to his screen like we do waiting fo the price to drop...
But I have to say my confidence in this dropping is not that high even tough my previous analysis told me that, you guys what do you think what could hold the price for that long, is it the DOW that's rising?
Ignored
Indeed, I was watching TV and doing other stuff, it takes time for a trade to devolop.. magic ain't happening.. you've got to be patient and confident
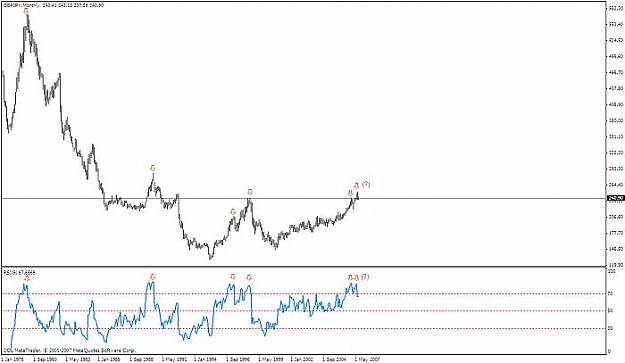
Posted this Monthly Chart in the other thread as well. Notice whenever RSI breaches 70 a retracement occurs, sometimes even a change in trend. Every 8 to 10 years (1980, 1990, 1998, 2007) there seems to be a shake out. I know some people think that carry trades are unstoppable but something caused the major reversals in these other years. Besides, ultimately there is more money to be made in pips than in interest in any trade. What do you think? I'd be interested in comments on this chart from either a fundamental or technical point of view.
I'll waste my time some more and predict that GJ will like be at 230 by the end of next week. The stock market is also likely to fall as fast as the circuit breakers allow all week.
I could be wrong, but I think it all hurtles off the cliff next week.
Hey Orient, how much did you lose? I hope you weren't long (seriously).
Posted this Monthly Chart in the other thread as well. Notice whenever RSI breaches 70 a retracement occurs, sometimes even a change in trend. Every 8 to 10 years (1980, 1990, 1998, 2007) there seems to be a shake out. I know some people think that carry trades are unstoppable but something caused the major reversals in these other years. Besides, ultimately there is more money to be made in pips than in interest in any trade. What do you think? I'd be interested in comments on this chart from either a fundamental or technical point of view.
M2B
Ignored
In stocks 70 rsi is overbought, in currencies overbought is 80 to 85 not 70. "Technical Analysis Applications in the Global Currency Markets" Author Cornelius Luca. John Murphy in his books also makes the same distinction.
I don't believe it. I closed out at 24200 to break even thinking it was never going to go down and didn't want to risk a rally due to carry trades, and then it suddenly drops 100+ pips! If I'd waited 10 more minutes it would've been pip pip hooray! Oh well.
I'm going to post 3 charts that I trade with and explain what I see on each TF
Daily:
Fibonacci Retracement levels (221.05 to 251.07)
5 Trendlines drawn (2 are weekly, 3 daily)
As you can see in the chart, we are in a nice triangle.. the last candle closed as a bearish engulfing which indicates strong bearish movement. Based on the daily chart, next targets might be 239.60 and 236.05
You can see on the chart the price touched the 38.2% fibo level twice and fell, it couldn't break it. It's very close to it's 23.6% fibo (240.70), it will be easy to break as you see price has cut through it before several times.
After reaching 243.11, we got stuck in a boring range for hours, then price penetrated the 23.6% fibo but it came up again, the second attempt it took out the 23.6 and 38.2 fibo, then the market closed for the week
The 61.8 fibo of this last bull run and the daily 38.2 fibo are very close to each other, we might have good support there and it might take a little while till it breaks it.
But how do you interpret the daily trend line that goes right between the 50 level on H1 and 23.6 on H4, and also those levels, aren't those also strong levels?
Maybe the price will range there or do you think it will fall right through to 239.7-239.6 area of those to other fibs?
After reaching 243.11, we got stuck in a boring range for hours, then price penetrated the 23.6% fibo but it came up again, the second attempt it took out the 23.6 and 38.2 fibo, then the market closed for the week
The 61.8 fibo of this last bull run and the daily 38.2 fibo are very close to each other, we might have good support there and it might take a little while till it breaks it.
My thanks goes out to the many who post here showing their various levels of expertise. You know who you are... and to all those who are new and learning for the courage to continually ask pertinent questions.
Two weeks ago I knew 'squat' about TA and the various indicators....(didn't really care to learn) then happened to stumble upon these two GJ sites at FF. Previously for 18 months was dumbed down and ignorantly comfortable (I didn't say particularly profitable) trading off of a trend recognition software (based on an algorithm formulation of certain indicators) where the charts simply showed buying and selling pressure in trend lines and multiple time frames along with some simple candlestick charting I learned 8 years ago in the stock market. Recently I spoke with another software owner I happen to respect who mentioned his success has come from adding certain outside indicators I see being discussed here. He encouraged me to take it to the next level and here I am.
Though this thread was started by Auslanco, personally, I don't miss him since too much was riding on his every word and it was never really presented in coherent manner conducive to learning. I appreciate all who have come forward to share, mentor and discuss their views and methods of success while trading this most interesting pair.
As far as TA is concerned, all along I thought "fibonacci" was the mob guy snich who gave witness testimony against John Abruzi on "Prison Break"..... lol
Dr. D. - with so much to learn while.... sleepinginadumpster
But how do you interpret the daily trend line that goes right between the 50 level on H1 and 23.6 on H4, and also those levels, aren't those also strong levels?
Maybe the price will range there or do you think it will fall right through to 239.7-239.6 area of those to other fibs?
Ignored
Ofcourse it might act as support, it has supported several times before and it also went through it once when it reached 237.58, you shouldn't just rely on fibo's.. it depends also on the candlestick formation pattern (mainly 4H and daily)
Price doesn't just usually touch the fibo level and bounce, if you look at the charts.. price pierced through fibos many times but then closed above, where the candle closes is very important.
You should combine all of it together and NOT just rely on 1 indicator, you need to have some back up and confirmation