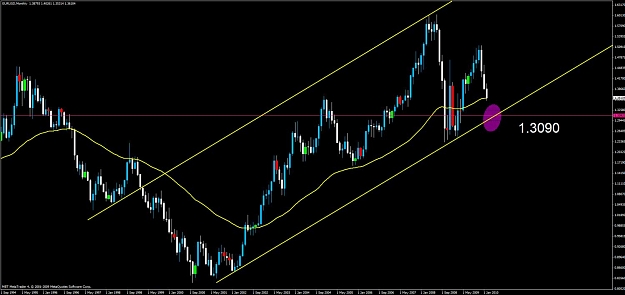
DislikedYES, i indeed trade/look at the eur. my view is the EXCACT oppesite from you. IM LOOKING FOR A DRAMATIC REVERSAL.. WENT LONG RIGHT AT THE BOTTOM @ 1.3450 (next week is the key,where i hope a big pullback and close as a spike low on monhtly,otherwise i will look closely and see if we not spike low to 1.3090 for the bottom.. we will test new highs in Q4 , Q1(2011) .
thats only my view and im sure it differs from the majority. and too much is eur negative..i need next week a close above 1.38 to add more weight on my view...Ignored
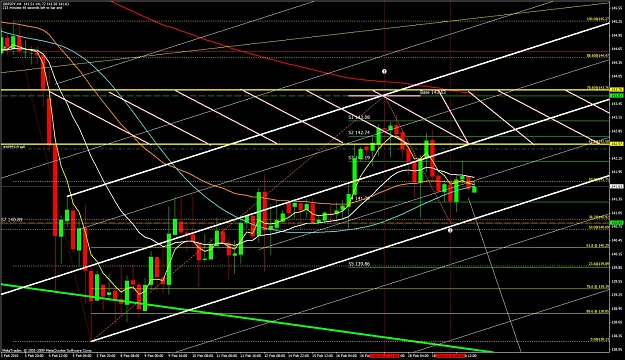
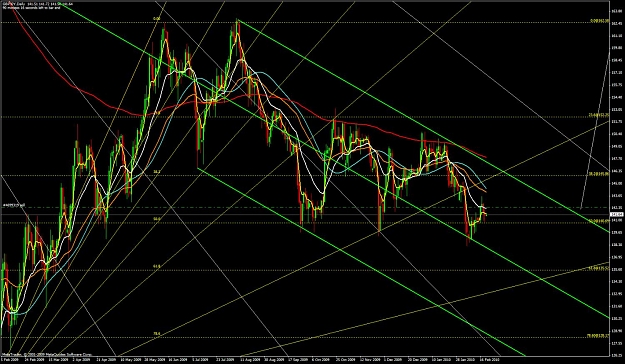
Here is the Bullish Count...
If we have WAVE4 GOING BELOW 50% OF WAVE3.. THEN WAVE5 COULD BE SHORT..
so far as you can see in this chart we have not breached 50%..@123xx
50% is at 121xx...
If we are in Wave 4..then this is the rule Iam considering..
W.4
If W.2 was an ABC then W.4 will probably be complex and vica versa. This is the priciple of alternation.
Look for minimum of three fractals in lower time frame and minimum price relationship of 62% to W.2
W.4 should not penetrate W.1. A W.4 close into W.1 invalidates the W.5 setup. This is a Rule.
Price extreme often occurs before the termination of the W.4 pattern. In complex waves Time factors should be the primary consideration.
If Wave 4 has exceed >50% of Wave 3, the possibility of a 5thwave failure is increased.
The Oscillator will cross the zero line two times during W.4. First against the direction of W.3 and then in the direction of W.3 to signal that W.4 has fulfilled minimum requirements for completion.
PRICE
< 50% of W.3
W.4 38% W.3 common
W.4:W.3 < W.2:W1 on percentage basis
W.4 62% 100% 162% W.2
W.4 > 23.6% < 50% W.0 - W.3
TIME
W.4 most often related to W.3 or W.0 - W.3
Often longer in time than W.3 / W.0 - W.3
W.4 138% - 162% of Parallel Projection of ends of W.1 - W.3 measured from beginning of W.2
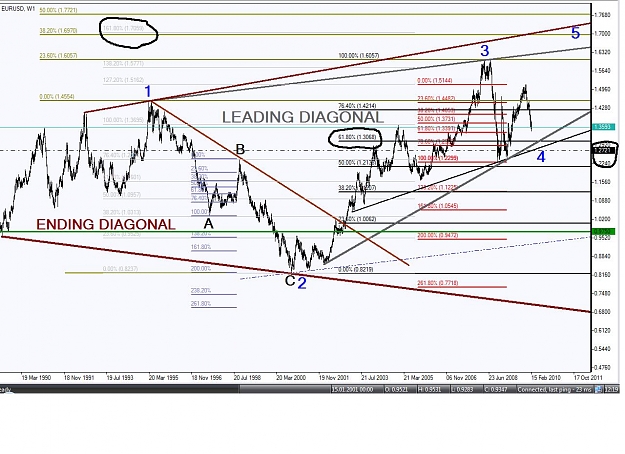
Wave 4 Penetrated wave 1 ...Its allowed in Diagonal..
I am not gonna say you are wrong...
Yes it can go to 1.30xx...I would prefer to try a long when it reaches 127xx..
What would be your target for NEW HIGH?
Here is the Chart...with Bullish View..
I dont have the Chart with prior History than that...so I consider that wave1 as wave 1..I will look for the broker who can provide an Yearly Chart..
Attached Image (click to enlarge)
Markets are not Random, they are designed!