***Read post 25 first before you continue reading because there is a guy named whatfx who showed that this strategy is not going to work for you and you should better not to waste you time here if you believe his words.***
Foreword:
I apologize to all those who have been following me and using my system from my previous thread “Yet Another Heiken Ashi strategy – A Tribute to lawgirl21”. The reason I have discontinued the thread is not because I’m not having success with it, but I feel obliged to optimize the entry timing of the system rather than relying solely on Heiken Ashi to make every trading decision.
Although HA itself is a lagging indicator, I have demo traded it (for 3 months) and live traded it (for 2 weeks) with good results until recently I found two major drawbacks when using the system. First, it does not help in identifying price pullbacks so we lose the option of “buying the dips and selling the rallies” and we are just simply making random entries each time. This could result in a huge drawdown if the market retraced deeply. Second, exiting trades based on changing color of HA could often burn away our profits and it is not flexible.
Improving winning odds by using MTFA:
Trading is all about probability. Price can either moves up or down, that’s all. I ignore sideway markets if I see no setups and good reasons to do so. I always employ multiple time frames analysis (MTFA) to assist my trading decision just like what exactly I did in my previous MTF Heiken Ashi strategy. Before using my strategy one should fully understand what multiple time frames is so please take your time to read this well-written article by Dons Steinitz. Below are 3 important points that I've extracted according to the Laws of Multiple Time Frames:
1. Every time frame has its own structure.
2. The higher time frames overrule the lower time frames.
3. Prices in the lower time frame structure tend to respect the energy points of the higher time frame structure.
To summarize, MTFA is a technique of using multiple higher time frames to determine a significant trend first, then taking entry signals directly only from smaller time frame charts. The general idea is to trade when there is alignment with the prevailing trend. (Source: http://www.markettradingconcepts.com...=57&Itemid=101)
Setups:
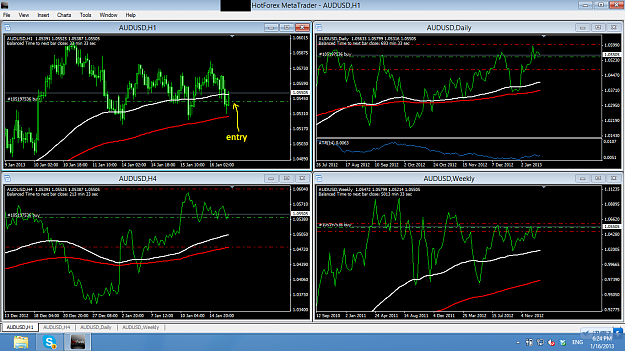
This is a very simple MTF strategy by using only two moving averages, the 100 period EMA (white) and the 200 period EMA (red). For this strategy I would be only using the H1, H4, D1 and W1 time frames. So please be patient set them up accordingly just like what I did (see below screenshot). You can also switch period between charts too. Sometimes I avoid being distracted by standard candlestick chart so I use a line chart instead (it is up to you). I added an Average True Range (period=14) only to the D1 chart.
**The 200 EMA is one of the most popular indicators of all time with Forex traders the world over, and for that reason alone is worth noting due to the psychological effect on the market place price can have when hovering around the 200 EMA (I found this somewhere from FF).**
Buy rules:
Price is clearly above the 100EMA and 200EMA across the H4, D1 and W1 time frames. Buy only when price dips between the 100EMA and 200EMA on the H1 chart. Open a second trade if price closed outside the range of 200EMA.
Sell rules:
Price is clearly below the 100EMA and 200EMA across the H4, D1 and W1 time frames. Sell only when price rallies between the 100EMA and 200EMA on the H1 chart. Open a second trade if price closed outside the range of 200EMA.
Exit Rules:
Stop loss - Input the current ATR value as shown on the D1 chart as your emergency SL. Hold your trade as long as your SL is not hit.
Take profit - This should depend on your trading style and holding period. I use a risk to reward ratio of 1:1 or 1:2, and sometimes the nearest S/R level (Murray Math Lines) for TP.
Here is a live example of how I enter the market:
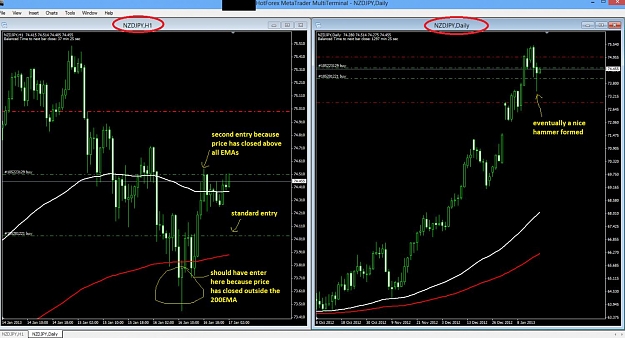
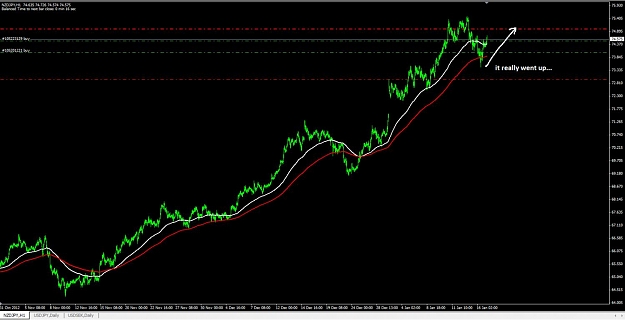
1. First I determine the major trend. Price must be above the 100EMA and 200EMA across the H4, D1 and W1 time frames. From the screenshot below NZD is clearly overwhelming JPY (by the time of writing JPY is the weakest currency) so my priority would be only long NZD/JPY.
2. Now I search for a good entry signal on the H1 chart. Sometimes price would touch the 100EMA and bounce off, but in this example price has dipped between the 100 EMA and 200 EMA so I make a long entry here.
My trading system explained:
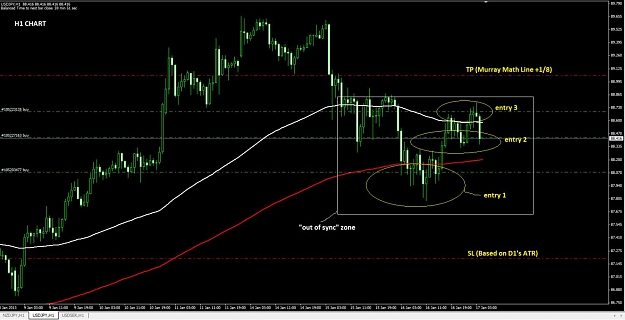
The strategy is based on the solid principle of buying the dips and selling the rallies because price would often make a pullback after a strong rally or dip. It is very similar like using RSI or stochastic to determine overbought or oversold condition except that I am using only moving averages with combination of MTFA. The logic is simple and straightforward: Price on the lower time frame will always tend to respect what the higher time frames are showing. When price on the lower time frame is “out of sync” (counter-trend), it signals an opportunity for us to wait and pull entry trigger there. Below screenshot is taken from my USD/JPY live trade to illustrate this idea:
Below screenshot is a visual backtest of using the system on the H1 chart with all entry criteria met.
*This is the result after 16/1/2013.
Final notes to my readers:
This is a high probability system but it is also a very risky one. I suggest everyone to use a logical stop loss placement and manage your risk carefully because we’ll never know when the market will turn against us and eat our account. Once you placed a trade you should just let the market to finish its job for you. There are only 2 outcomes for sure when using this system:
Outcome 1: Your SL get hit and you lose money. But you could deal with this if you allow yourself to lose money that you are comfortable to lose with. I learned this important lesson from Nial Fuller that you should think of risk in term of dollar, not percentage of your trading account or pip count. Although trading the longer time frame requires a larger stop loss, the risk exposure is still the same if you limit the lot size you trade.
Outcome 2: Your TP get hit and you win money. Look for another entry opportunity if the moment comes but never attempt to rush and chase the market. If there is no signal, either you wait, search signals from other pairs, or you do nothing. The best way not to lose money is not to trade at all if there is no good reason to do so.
I welcome any comments or criticisms if you have something to say or new ideas to share of improving the accuracy of the system after reading my thread. This refined strategy utilized the same MTFA approach just like my previous MTF Heiken Ashi system except that we are given chance only to buy or sell pullbacks. You can use a currency strength meter (CSM) from my old thread here to assist yourself in making trading decision and increasing your winning odds.
Thank you for taking your precious time to read my new thread and I wish you good luck in your forex trading career.
Best regards,
amikaking
Foreword:
I apologize to all those who have been following me and using my system from my previous thread “Yet Another Heiken Ashi strategy – A Tribute to lawgirl21”. The reason I have discontinued the thread is not because I’m not having success with it, but I feel obliged to optimize the entry timing of the system rather than relying solely on Heiken Ashi to make every trading decision.
Although HA itself is a lagging indicator, I have demo traded it (for 3 months) and live traded it (for 2 weeks) with good results until recently I found two major drawbacks when using the system. First, it does not help in identifying price pullbacks so we lose the option of “buying the dips and selling the rallies” and we are just simply making random entries each time. This could result in a huge drawdown if the market retraced deeply. Second, exiting trades based on changing color of HA could often burn away our profits and it is not flexible.
Improving winning odds by using MTFA:
Trading is all about probability. Price can either moves up or down, that’s all. I ignore sideway markets if I see no setups and good reasons to do so. I always employ multiple time frames analysis (MTFA) to assist my trading decision just like what exactly I did in my previous MTF Heiken Ashi strategy. Before using my strategy one should fully understand what multiple time frames is so please take your time to read this well-written article by Dons Steinitz. Below are 3 important points that I've extracted according to the Laws of Multiple Time Frames:
1. Every time frame has its own structure.
2. The higher time frames overrule the lower time frames.
3. Prices in the lower time frame structure tend to respect the energy points of the higher time frame structure.
To summarize, MTFA is a technique of using multiple higher time frames to determine a significant trend first, then taking entry signals directly only from smaller time frame charts. The general idea is to trade when there is alignment with the prevailing trend. (Source: http://www.markettradingconcepts.com...=57&Itemid=101)
Setups:
This is a very simple MTF strategy by using only two moving averages, the 100 period EMA (white) and the 200 period EMA (red). For this strategy I would be only using the H1, H4, D1 and W1 time frames. So please be patient set them up accordingly just like what I did (see below screenshot). You can also switch period between charts too. Sometimes I avoid being distracted by standard candlestick chart so I use a line chart instead (it is up to you). I added an Average True Range (period=14) only to the D1 chart.
**The 200 EMA is one of the most popular indicators of all time with Forex traders the world over, and for that reason alone is worth noting due to the psychological effect on the market place price can have when hovering around the 200 EMA (I found this somewhere from FF).**
Attached Image (click to enlarge)
Buy rules:
Price is clearly above the 100EMA and 200EMA across the H4, D1 and W1 time frames. Buy only when price dips between the 100EMA and 200EMA on the H1 chart. Open a second trade if price closed outside the range of 200EMA.
Sell rules:
Price is clearly below the 100EMA and 200EMA across the H4, D1 and W1 time frames. Sell only when price rallies between the 100EMA and 200EMA on the H1 chart. Open a second trade if price closed outside the range of 200EMA.
Exit Rules:
Stop loss - Input the current ATR value as shown on the D1 chart as your emergency SL. Hold your trade as long as your SL is not hit.
Take profit - This should depend on your trading style and holding period. I use a risk to reward ratio of 1:1 or 1:2, and sometimes the nearest S/R level (Murray Math Lines) for TP.
Here is a live example of how I enter the market:
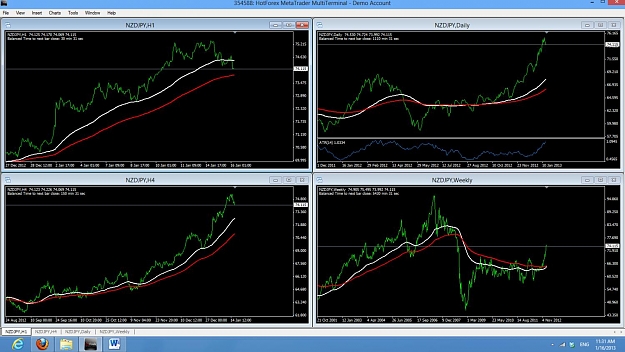
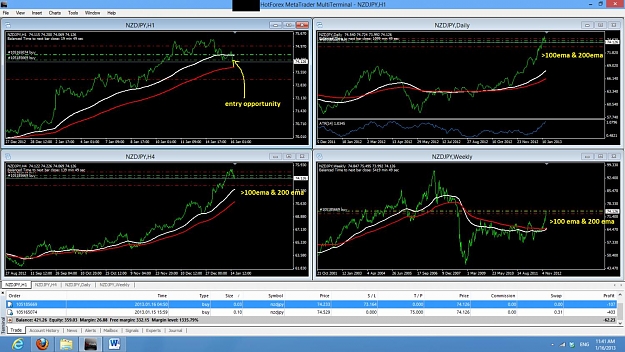
1. First I determine the major trend. Price must be above the 100EMA and 200EMA across the H4, D1 and W1 time frames. From the screenshot below NZD is clearly overwhelming JPY (by the time of writing JPY is the weakest currency) so my priority would be only long NZD/JPY.
2. Now I search for a good entry signal on the H1 chart. Sometimes price would touch the 100EMA and bounce off, but in this example price has dipped between the 100 EMA and 200 EMA so I make a long entry here.
Attached Image (click to enlarge)
My trading system explained:
The strategy is based on the solid principle of buying the dips and selling the rallies because price would often make a pullback after a strong rally or dip. It is very similar like using RSI or stochastic to determine overbought or oversold condition except that I am using only moving averages with combination of MTFA. The logic is simple and straightforward: Price on the lower time frame will always tend to respect what the higher time frames are showing. When price on the lower time frame is “out of sync” (counter-trend), it signals an opportunity for us to wait and pull entry trigger there. Below screenshot is taken from my USD/JPY live trade to illustrate this idea:
Attached Image (click to enlarge)
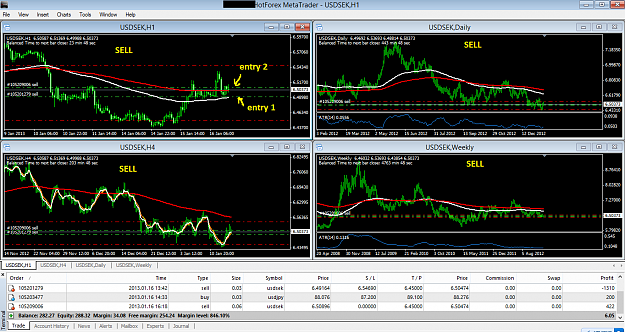
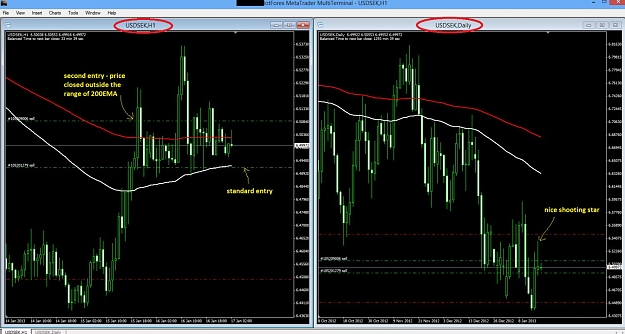
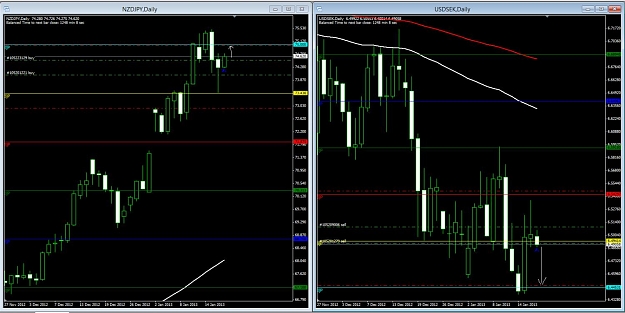
Below screenshot is a visual backtest of using the system on the H1 chart with all entry criteria met.
Attached Image (click to enlarge)
*This is the result after 16/1/2013.
Attached Image (click to enlarge)
Final notes to my readers:
This is a high probability system but it is also a very risky one. I suggest everyone to use a logical stop loss placement and manage your risk carefully because we’ll never know when the market will turn against us and eat our account. Once you placed a trade you should just let the market to finish its job for you. There are only 2 outcomes for sure when using this system:
Outcome 1: Your SL get hit and you lose money. But you could deal with this if you allow yourself to lose money that you are comfortable to lose with. I learned this important lesson from Nial Fuller that you should think of risk in term of dollar, not percentage of your trading account or pip count. Although trading the longer time frame requires a larger stop loss, the risk exposure is still the same if you limit the lot size you trade.
Outcome 2: Your TP get hit and you win money. Look for another entry opportunity if the moment comes but never attempt to rush and chase the market. If there is no signal, either you wait, search signals from other pairs, or you do nothing. The best way not to lose money is not to trade at all if there is no good reason to do so.
I welcome any comments or criticisms if you have something to say or new ideas to share of improving the accuracy of the system after reading my thread. This refined strategy utilized the same MTFA approach just like my previous MTF Heiken Ashi system except that we are given chance only to buy or sell pullbacks. You can use a currency strength meter (CSM) from my old thread here to assist yourself in making trading decision and increasing your winning odds.
Thank you for taking your precious time to read my new thread and I wish you good luck in your forex trading career.
Best regards,
amikaking
Attached File(s)