Hi Global, I'm afraid I fibbed a bit in the Mu descriptions.
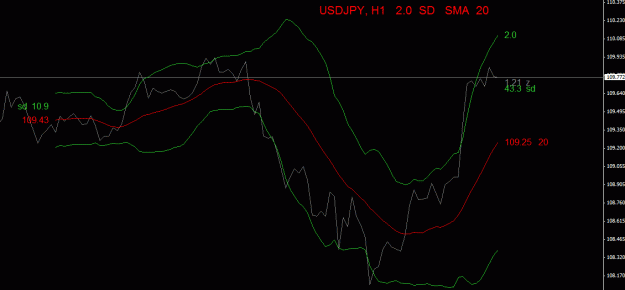
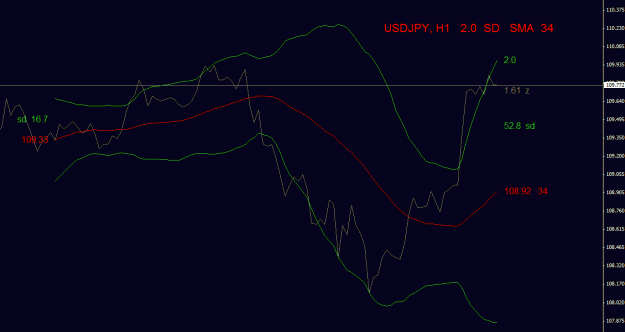
Even though a Mu average is made up of a "population" of 9 TFs, one still needs to select a specific SMA Period.
How to be sure the "right" choice has been made for the best reads on different Pairs and market cycles?
Something standard, 20-25 Period on all Pairs at all times, would at least allow for comparison.
It appears these "Mus" are just "samples" from another "population", made up this time of SMA Periods!
And when one starts plotting such series of "Mu value versus Period", things get interesting in a hurry.
We wind up with a data display that is invariant over both; selection of Time Frame *and* SMA Period.
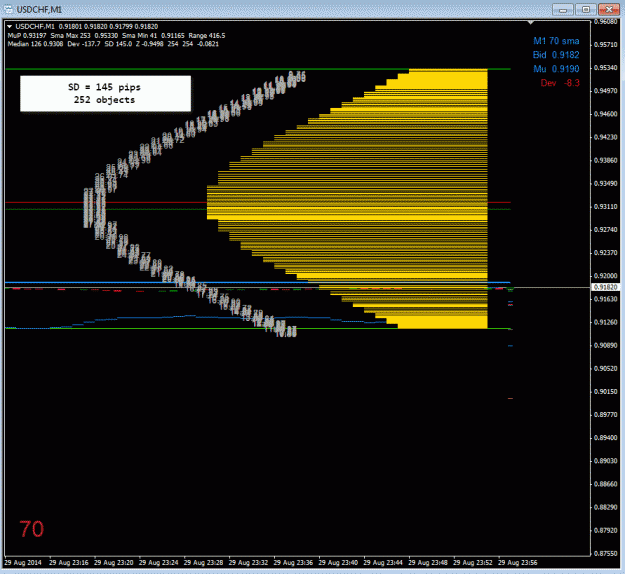
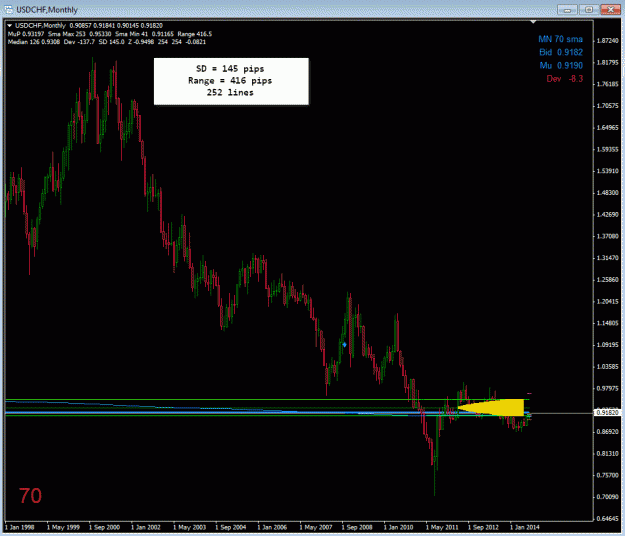
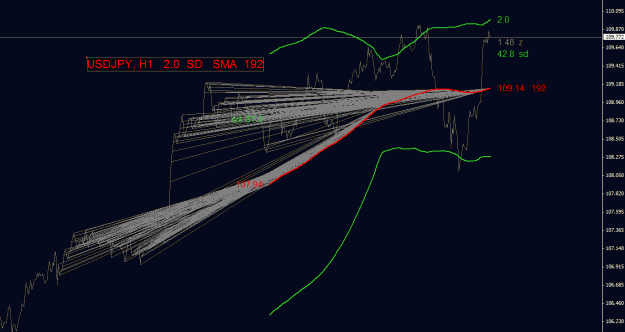
The very long monthly periods consume a large part of the market.
Ten to twenty years are needed to calculate the first SMAs over 120 to 240 Bars.
An impressive volume of data, culled over decades, winds up as on-tick values on Bar #0.
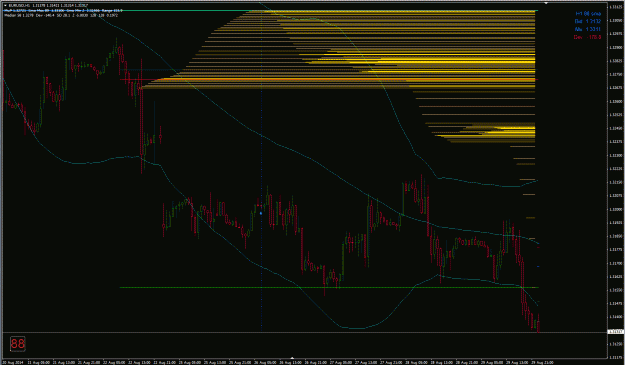
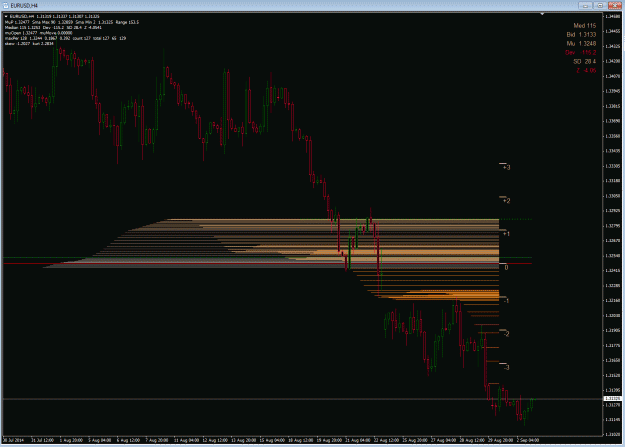
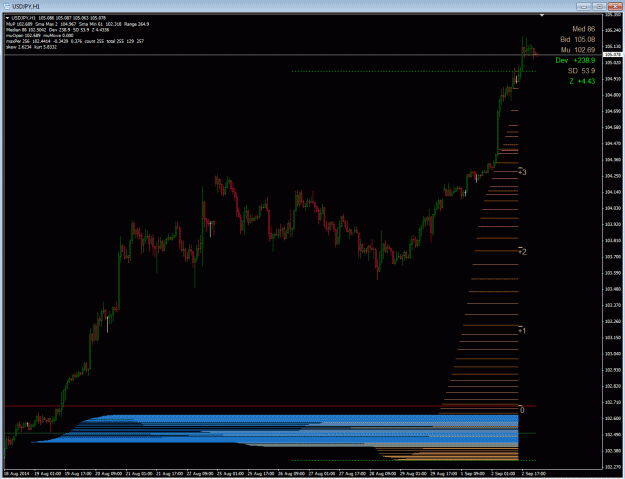
This is a spin-off from Mu and Average Joe.mq4, so the initial view is overlaid:
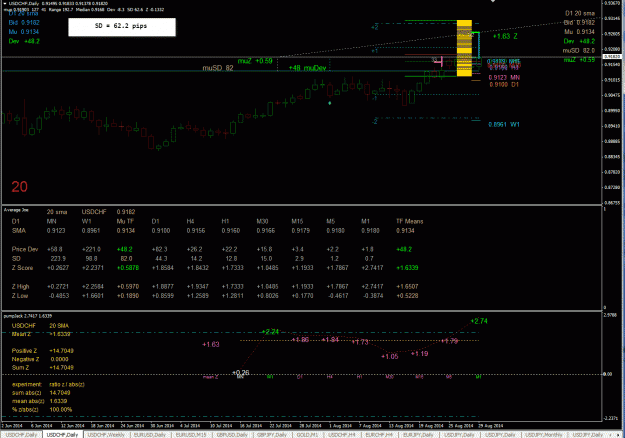
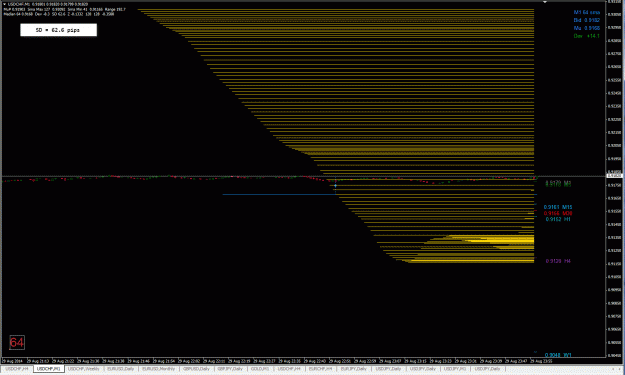
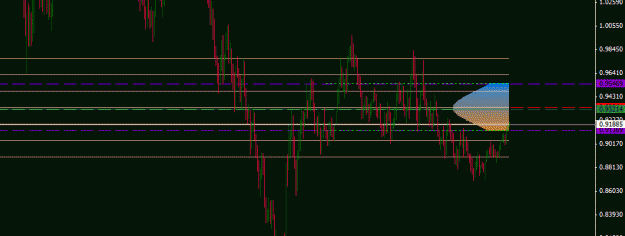
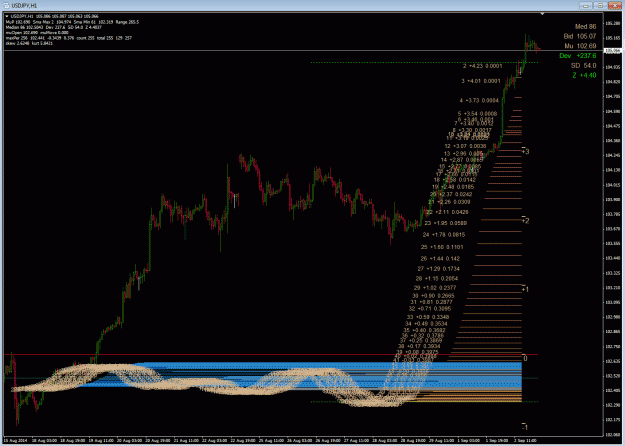
Current USDCHF. Gold lines have been plotted for Periods 2 to 127, a total of 126.
The range of price values covers 193 Pips. The Red Line is a calculated "Super Mu" at 0.9190
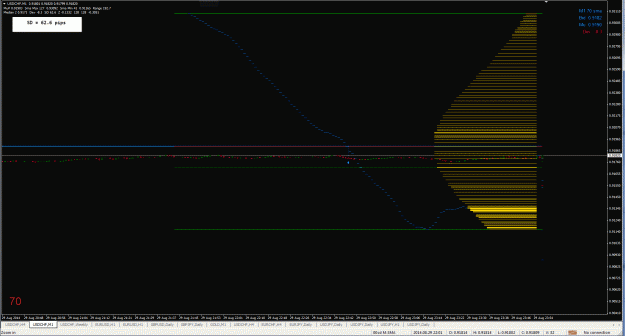
An SD for the distribution is found at 62.2 pips and that will be seen in the next few images also.
In general SDs found will be much lower than those from the 9 SMA distributions.
More to follow.
Even though a Mu average is made up of a "population" of 9 TFs, one still needs to select a specific SMA Period.
How to be sure the "right" choice has been made for the best reads on different Pairs and market cycles?
Something standard, 20-25 Period on all Pairs at all times, would at least allow for comparison.
It appears these "Mus" are just "samples" from another "population", made up this time of SMA Periods!
And when one starts plotting such series of "Mu value versus Period", things get interesting in a hurry.
We wind up with a data display that is invariant over both; selection of Time Frame *and* SMA Period.
The very long monthly periods consume a large part of the market.
Ten to twenty years are needed to calculate the first SMAs over 120 to 240 Bars.
An impressive volume of data, culled over decades, winds up as on-tick values on Bar #0.
This is a spin-off from Mu and Average Joe.mq4, so the initial view is overlaid:
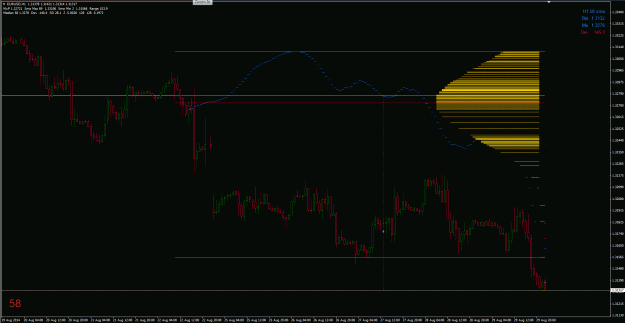
Attached Image (click to enlarge)
The range of price values covers 193 Pips. The Red Line is a calculated "Super Mu" at 0.9190
An SD for the distribution is found at 62.2 pips and that will be seen in the next few images also.
In general SDs found will be much lower than those from the 9 SMA distributions.
More to follow.