Hi Guys,
After reading 'behind order flow' thread a long time ago, one thing stood out - stop losses, ie large clusters of orders.
I can't remember who mentioned it but it was something like this-
Banks need to get their large orders into the market without moving the price - what this means is that they have to sell into large clusters of buy orders and buy into large clusters of sell orders. Basically the opposite of the majority of the uninformed players.
So the big question is where are the majority of the stop losses?
This is a difficult question to answer as presumably they are everywhere.
But, what I have done is to try and develope a simple method using the daily low and daily high as a break out area. We know that huge orders will be tripped around these areas specifically.
See the chart examples for cable.
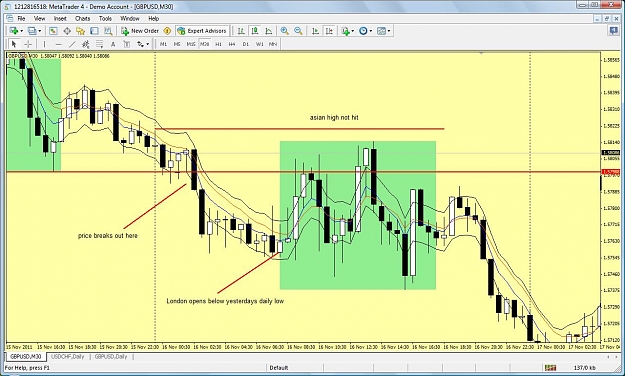
The first chart shows a typical breakout of yesterdays daily low.
London then moves price to the break out area and then it is sold.
If you put your stop loss just above the Asian high then your trade made profit.
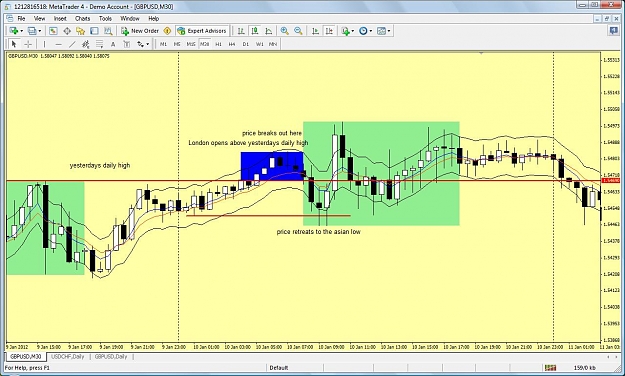
Look at the second example
The breakout occurs again but this time London pushed price into the asian low, logically this is where many traders would put there stoplosses
(pure speculation based on chart observations) those traders buying on the breakout would have lost.
So, the idea is to buy the stop losses.
I only take the ones where price retreats to get the stops.
I don't even know if these are the stops but it seems likely?
I have only done 18 months visual backtesting, no forward tests as I have to work so won't be able to set the trades in the demo.
But the results are 28 net positive trades.
If you set each trade at 2% of your account then you are up 56% .
I would appreciate comments about the validity of the method, ie do you think these are where the stops are with this method and if there is some kind of filter that could be applied to alter the win rate.
Has anyone else got some chart examples with historical results that try to exploit stop losses?
Thanks Slim
After reading 'behind order flow' thread a long time ago, one thing stood out - stop losses, ie large clusters of orders.
I can't remember who mentioned it but it was something like this-
Banks need to get their large orders into the market without moving the price - what this means is that they have to sell into large clusters of buy orders and buy into large clusters of sell orders. Basically the opposite of the majority of the uninformed players.
So the big question is where are the majority of the stop losses?
This is a difficult question to answer as presumably they are everywhere.
But, what I have done is to try and develope a simple method using the daily low and daily high as a break out area. We know that huge orders will be tripped around these areas specifically.
See the chart examples for cable.
The first chart shows a typical breakout of yesterdays daily low.
London then moves price to the break out area and then it is sold.
If you put your stop loss just above the Asian high then your trade made profit.
Look at the second example
The breakout occurs again but this time London pushed price into the asian low, logically this is where many traders would put there stoplosses
(pure speculation based on chart observations) those traders buying on the breakout would have lost.
So, the idea is to buy the stop losses.
I only take the ones where price retreats to get the stops.
I don't even know if these are the stops but it seems likely?
I have only done 18 months visual backtesting, no forward tests as I have to work so won't be able to set the trades in the demo.
But the results are 28 net positive trades.
If you set each trade at 2% of your account then you are up 56% .
I would appreciate comments about the validity of the method, ie do you think these are where the stops are with this method and if there is some kind of filter that could be applied to alter the win rate.
Has anyone else got some chart examples with historical results that try to exploit stop losses?
Thanks Slim
Attached Image(s) (click to enlarge)