{quote} hello mate check that : www.mql5.com/en/code/16767 The guy made a good indicator out of COT report, using plenty of different datas It can help you a lot
Ignored
Thanks a lot! I don't use MT4 so I can't work off his code, but reviewing his documentation has given me some good ideas.
Self-sufficiency is the greatest of all wealth. - Epicurus
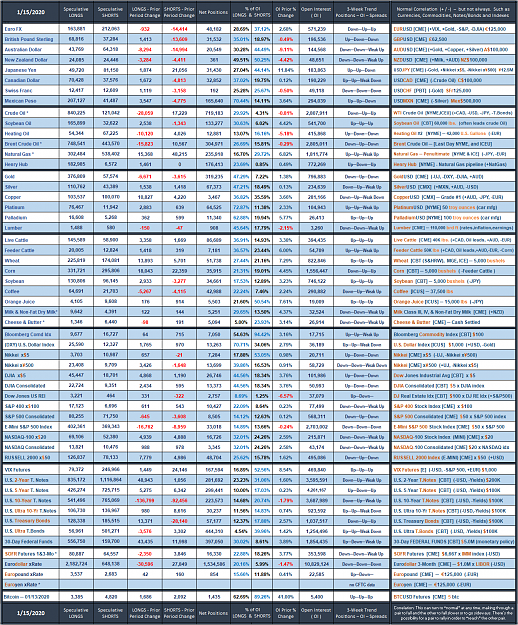
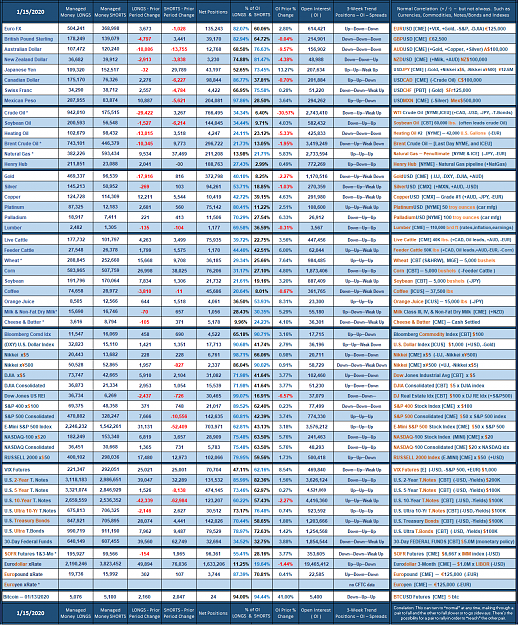
Commercials reduced their net positioning at an abnormally large rate during December while Asset-Managers currently hold gross long positions 3STD above average . Other notable features being that around mid December, Leveraged Funds removed a sizable number of gross short positions but have added back roughly %50% of them since then while on the other hand it looks like Asset manager short removal is dialing down as well.
Anyone else expecting a fall in the NZD ? Commercials reduced their net positioning at an abnormally large rate during December while Asset-Managers currently hold gross long positions 3STD above average . Other notable features being that around mid December, Leveraged Funds removed a sizable number of gross short positions but have added back roughly %50% of them since then while on the other hand it looks like Asset manager short removal is dialing down as well.
I can't respond in your journal thread so I'll respond here instead.
I don't think your graphs show what you think they do. How did you calculate the values?
"If we look at the first half of the chart (until the spike near 2000), money managers were not really involved in buying gold, while they should have bought a lot to make decent cash. The first few spikes in longs positioning didn't lead to any rally in gold, it lead to profit taking or dips. The rally towards 2000 happened when money managers were very low on longs (below 10%, mostly towards 5%)."
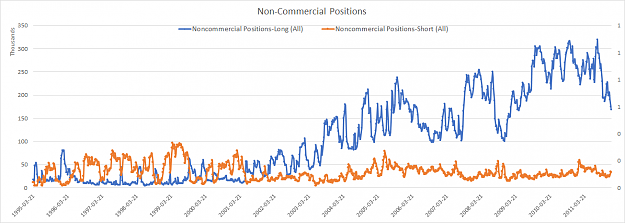
Graph of Gross- Non Commercial positions (1995-2012) from the Legacy Report
Attached Image (click to enlarge)
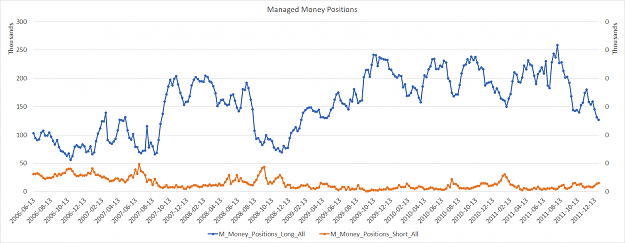
Graph of Managed Money positions (2006-2012) from the Disaggregated Report
Attached Image (click to enlarge)
The pre $2000 time period you're referring to was in fact accentuated by more longs than had ever been recorded and while there was profit taking with drops in price, there were also spikes in long contracts when price started to recover.
"After the spike towards 2000, that's where money managers went into buying gold, in a huge way, towards 30% and above 40% but prices kept falling."
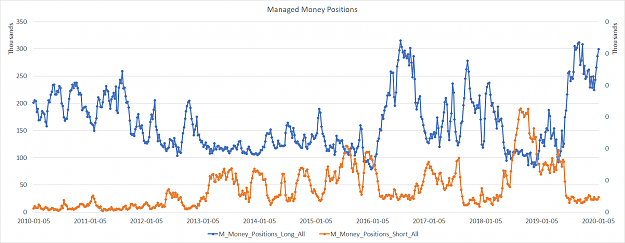
Managed Money Gross Positions 2010 to Present
Attached Image (click to enlarge)
The high for the period you're referencing in both price and long positions occurred around August 2011 after which long positions fell and rose in tandem with price as price topped out. Beginning in October 2012 price began to drop until December 2015, during this period Long Managed Money Contract Holders removed 100k positions from OCT-2012 to March 2013 before clustering around 100k total for the rest of the 2013. There was no major buying by Managed Money until Commercial Traders as a group stepped in around mid 2015 to start an uptrend.
" Overall bullish, but money managers are only 10% more or less"
I haven't been able to piece together what the graph of this statement is supposed to show. Can you explain what "spread money manager positions" is and how you've calculated it, as it doesn't seem like you used the spreaded positions provided by the CFTC?
--------------------------------------------------------------------------------------------------------------------------------------------------
Reportable traders on net have re-entered "extreme" territory(massive difference between longs and shorts) near the end of December, so its definitely one to watch.
{quote} I can't respond in your journal thread so I'll respond here instead. I don't think your graphs show what you think they do. How did you calculate the values? "If we look at the first half of the chart (until the spike near 2000), money managers were not really involved in buying gold, while they should have bought a lot to make decent cash. The first few spikes in longs positioning didn't lead to any rally in gold, it lead to profit taking or dips. The rally towards 2000 happened when money managers were very low on longs (below 10%, mostly...
Ignored
I have miscalculated, my datas crazy and i didn't double check on this one
you are right
{quote} I can't respond in your journal thread so I'll respond here instead. I don't think your graphs show what you think they do. How did you calculate the values? "If we look at the first half of the chart (until the spike near 2000), money managers were not really involved in buying gold, while they should have bought a lot to make decent cash. The first few spikes in longs positioning didn't lead to any rally in gold, it lead to profit taking or dips. The rally towards 2000 happened when money managers were very low on longs (below 10%, mostly...
{quote} Well, I like to think so! I started programming to take my investing to the next level. R has been an awesome tool, it's almost like it was made specifically for finance. {quote} Not yet, but I am pretty excited about comparing COT between different asset classes. I'll see if I can whip up a correlation matrix tonight. {quote} Thanks, I'll see what I can come up with. {quote} That sounds like a good idea to me, but outside the scope of COT. I'm just scratching the surface of COT so I'm going to see what else I can find...
Ignored
Sorry guys, I got sidetracked but I'm hoping to dive back into COT this week. I'd actually like to program a COT based strategy but it'll be a challenge so I can't make any guarantees.
Self-sufficiency is the greatest of all wealth. - Epicurus
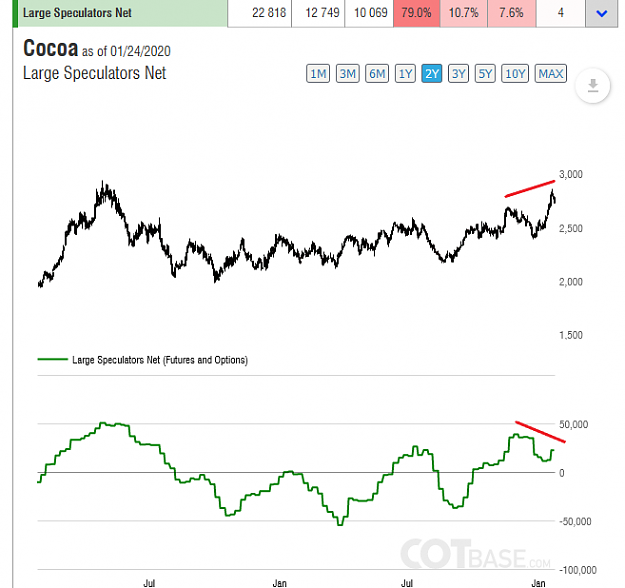
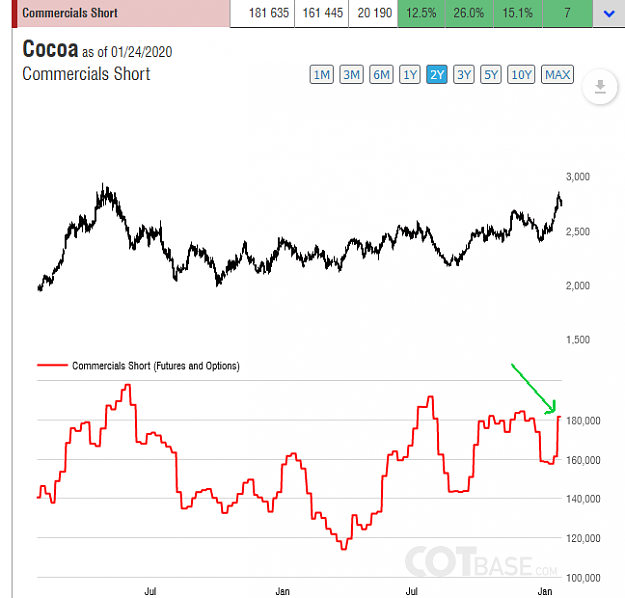
#1 - Cocoa - Large Specs Net positions. These guys are the fuel for trending markets. We follow them in Bull markets. When they fail to make higher highs with the trend it is a signal at a top that they have exhausted all their buying. This is a Bearish signal.
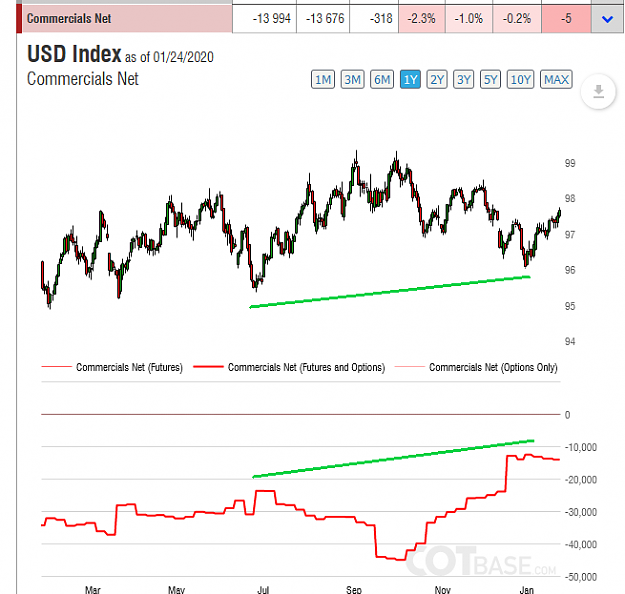
#2 - Big injection of Commercial Shorts ( Producers ) this week. They like selling at this inflated price
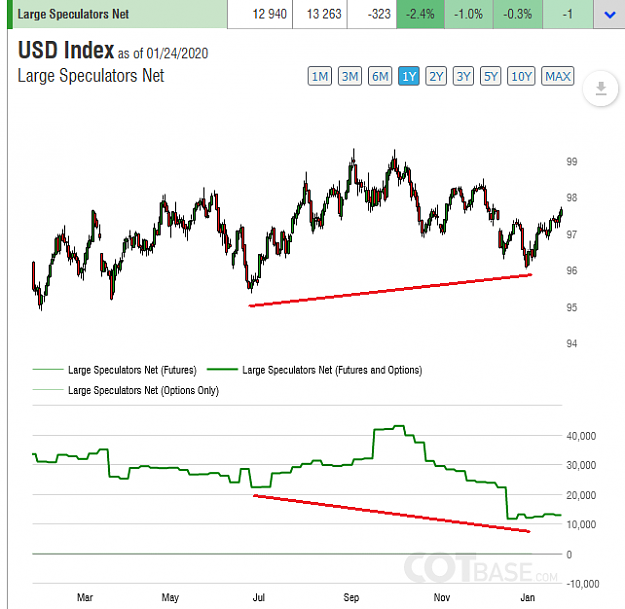
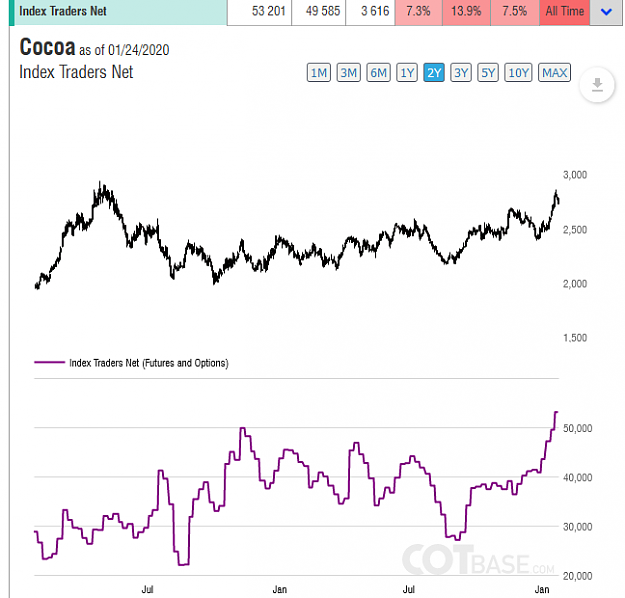
#3 - Turns out its the Index Traders responsible for the rally ( Swap Dealers / Funds ) They are mostly wrong at tops
#1 - Cocoa - Large Specs Net positions. These guys are the fuel for trending markets. We follow them in Bull markets. When they fail to make higher highs with the trend it is a signal at a top that they have exhausted all their buying. This is a Bearish signal. #2 - Big injection of Commercial Shorts ( Producers ) this week. They like selling at this inflated price #3 - Turns out its the Index Traders responsible for the rally ( Swap Dealers / Funds ) They are mostly wrong at tops {image} {image} {image}
Ignored
Attached Image (click to enlarge)
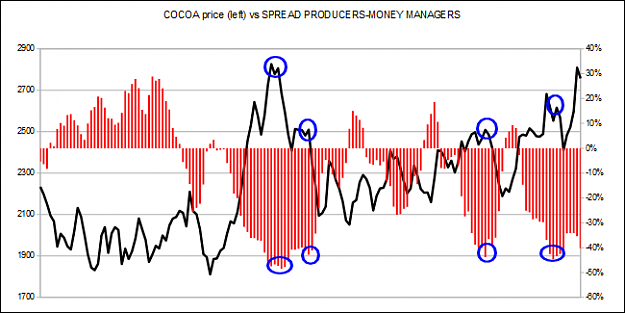
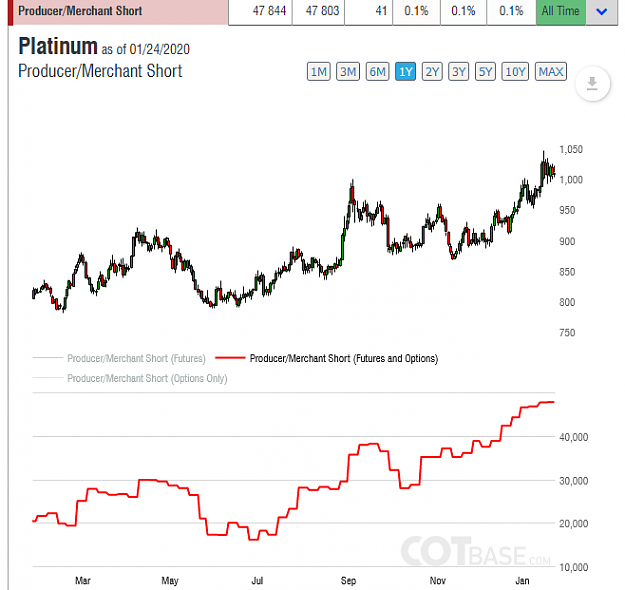
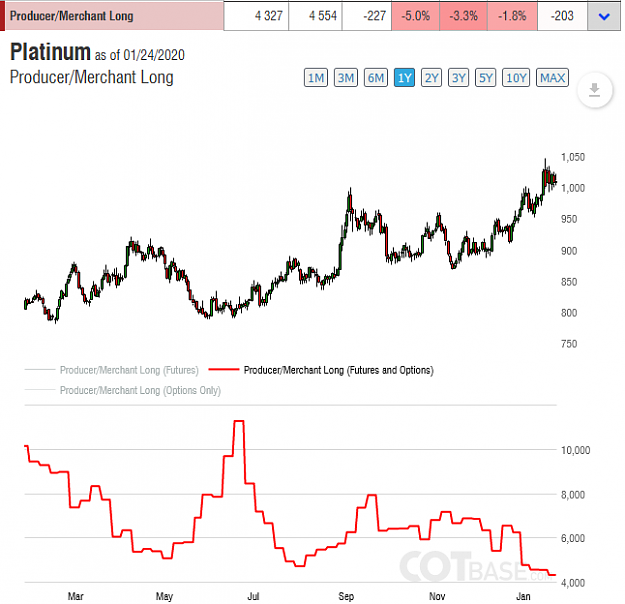
Strong increase in short producers & strong increase in longs money managers.
We could be in for a rush down until both reverse their positions and spread goes negative
Well, in fact, many brokers recommend certain systems, which imply that you focus on the performance of other traders before making a decision, but in my opinion this can be useful only at the very early stages when you are just starting to learn what trading is and what to do with it. In fact, to learn how to trade it will be absolutely not enough. Besides, you can just get used to the fact that you have some guidelines and basically you can not think about what to do and just copy someone's actions. This is not trading, it's a complete nonsense and I would not recommend it to anyone.
Well, in fact, many brokers recommend certain systems, which imply that you focus on the performance of other traders before making a decision, but in my opinion this can be useful only at the very early stages when you are just starting to learn what trading is and what to do with it. In fact, to learn how to trade it will be absolutely not enough. Besides, you can just get used to the fact that you have some guidelines and basically you can not think about what to do and just copy someone's actions. This is not trading, it's a complete nonsense...
Ignored
I'm sure quite a few things were lost in translation, but your statement is so cliché that I both question whether or not it was bot that wrote it and if it was even meant for this thread. It's usually the same misguided and short-sighted conjectures that prop up statements like these in regards to COT data. So much so that I grow weary of correcting them. I truly believe that where most people go wrong in attempting to use and interpret the data is their seemingly innocuous attempt to systemize it. Most people are ill-equipped to do so and fail recognize just how many biases are buried within their system and how narrowing that is for their understanding. So eager for short-term profits and to find something that "works" that they just barely develop a surface level understanding of the data before relegating it to "nonsense" as their attempts to systemize it fail. I doubt many people, especially newcomers, even attempt to consider WHY what they're doing should, shouldn't or does work. That's really the crux of the issue. No one really wants to know why.
Why is it all nonsense to you? Why is "focusing on the performance of other traders" a bad thing or more aptly, why is analyzing the actions of the larger, longer-term institutions involved in each market detrimental to a trader?
COT will not easily lend itself to any system. What it can do however is provide a framework for understanding the how and why institutions ebb and flow their positions. In doing this, there is plenty of room for someone to develop an understanding of the fundamentals, technicals, etc in conjunction with verifiable changes in longer term institutional positioning. Whether it be by chance or fate, most posts in this thread somehow reflect this idea in that they lack the typical entry, exit, stop loss you see in other threads and instead opt for highlighting possible outcomes for the future. I promise you, that if you approach COT data with the expectation that because insert X group bought or sold in the previous report then its a good idea to buy or sell now all the while not even attempting to understand the "bigger picture" then you will be disappointed.
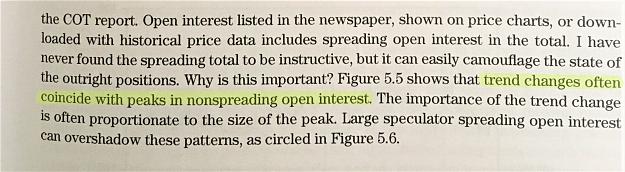
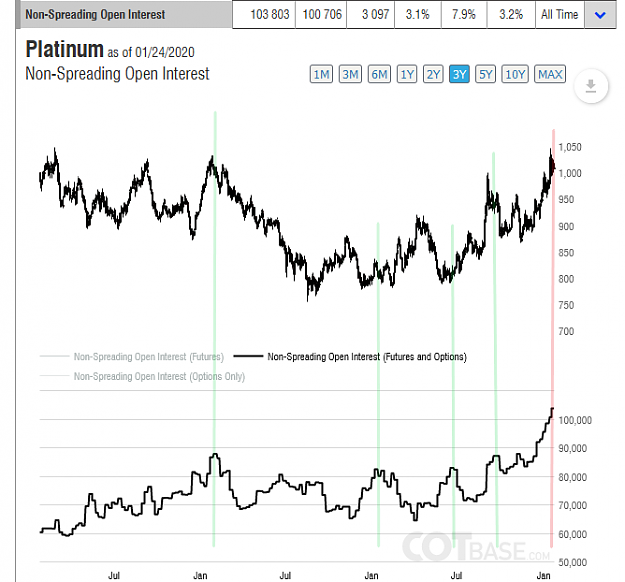
#1 - Steve Briese makes comment about how Peaks in Non spreading Open Interest can indicate trend reversals, both tops and Bottoms. Out of all the Metals Complex , its Platinum with all the extremes. I think we've seen the top ?
Hi guys, do you know how to view COT chart in Candle Stick?
Ignored
Hello my friend. You will not find any candlestick charts plotting the COT. The line chart represents contract total numbers , not Open - High - -Low- Close. You can find some literature on the subject via Larry Williams , Steve Briese , Floyd Upperman will get you up to speed. Welcome to the world of COT . Enjoy your ride.