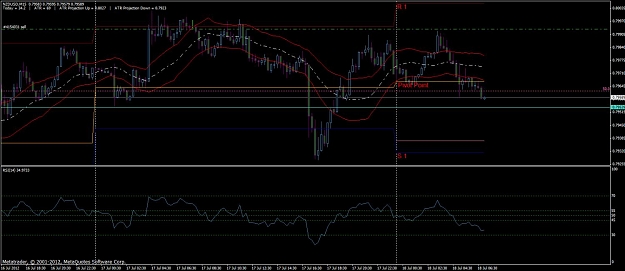
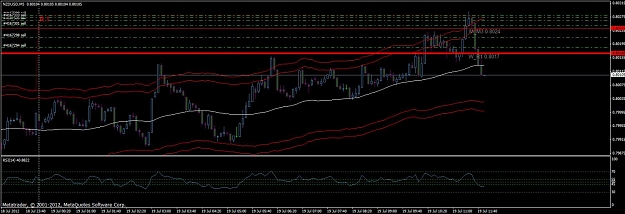
My experiences trading using the Keltner channel will be documented in my thread moving forward in the hopes that I can use it in review to correct any mistakes I make and build a foundation of profititable trades by repeating solid trade entries and exits using this indicator along with a few other to confirm my entries. Mostly through price action using candle charts I will use to some degree other indicators prior to placeing a trade.
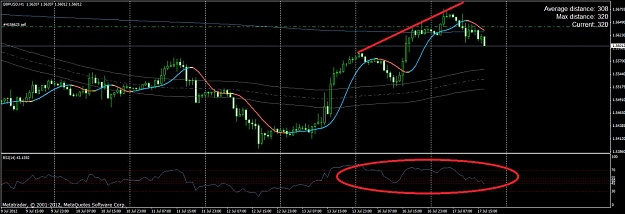
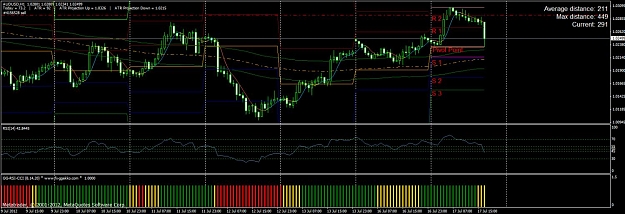
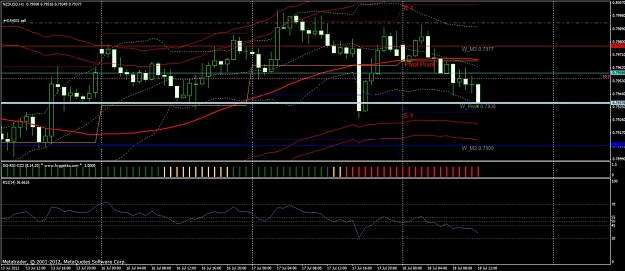
-Weekly and Monthly pivots
- Higher time frame fib retracements and extensions
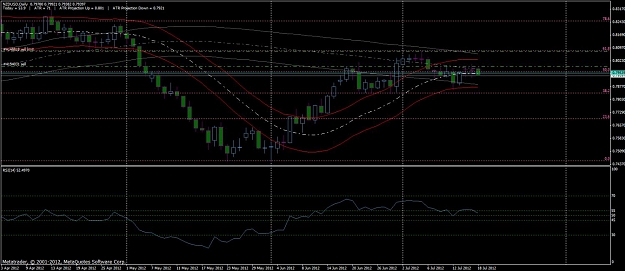
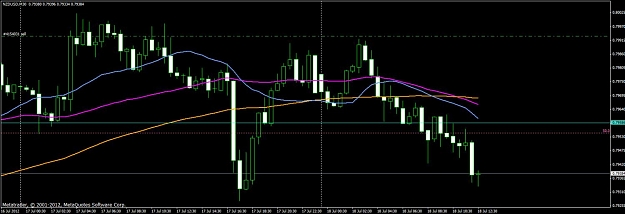
- Moving average
-rsi
-Awesome O
As for my money management I've learned that having more equity available to erase small losses is always better than not being able to so I only risk 1% of my account and exit losing trading quickly, without hesitation. I will consider re-entry as long as the bias of the trade has not changed. This sometimes offiers better profit and less risk.
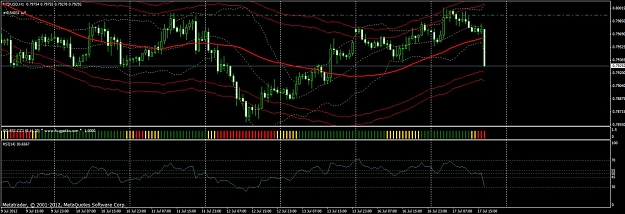
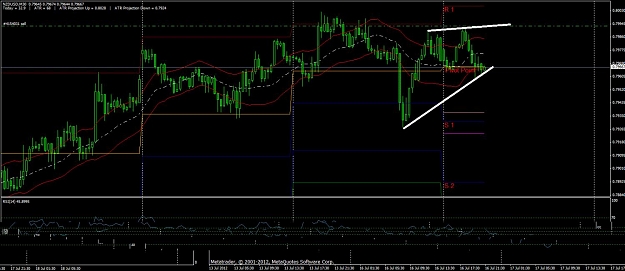
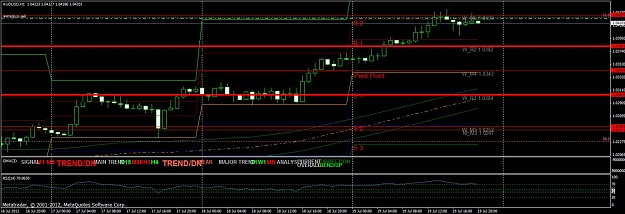
-Weekly and Monthly pivots
- Higher time frame fib retracements and extensions
- Moving average
-rsi
-Awesome O
As for my money management I've learned that having more equity available to erase small losses is always better than not being able to so I only risk 1% of my account and exit losing trading quickly, without hesitation. I will consider re-entry as long as the bias of the trade has not changed. This sometimes offiers better profit and less risk.
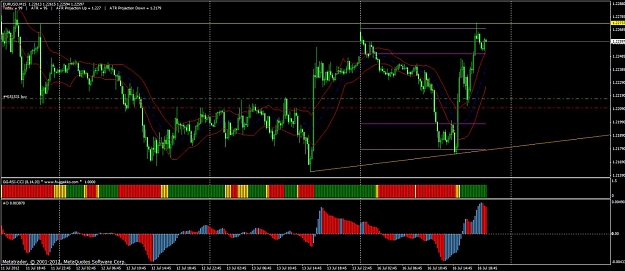
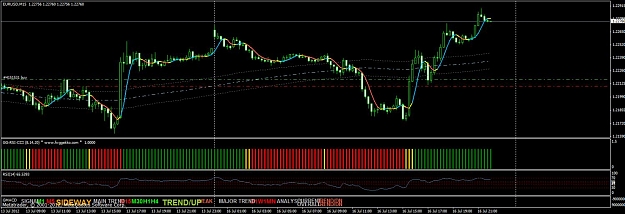
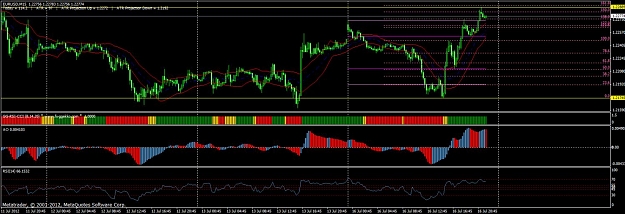
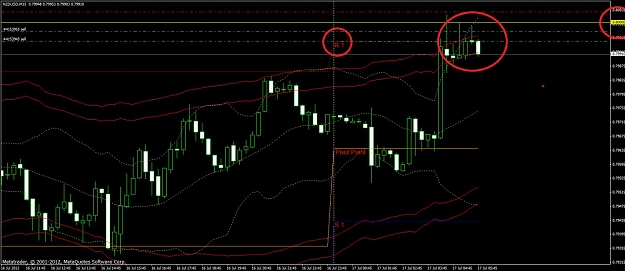
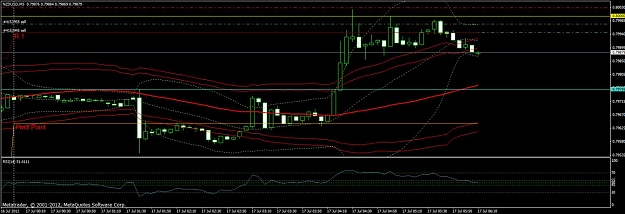
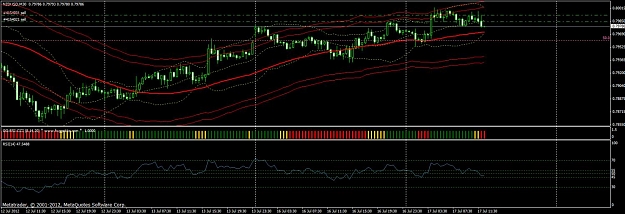
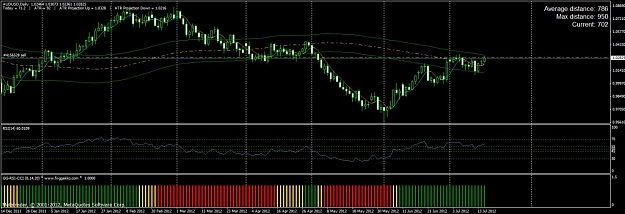
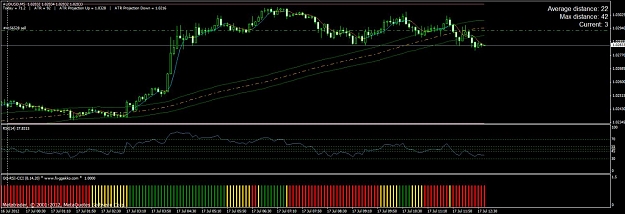
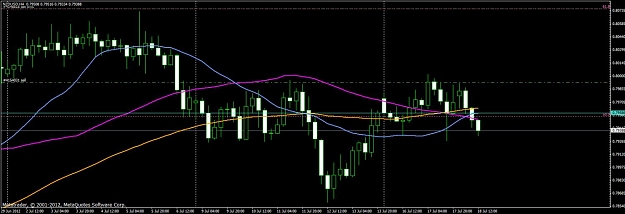
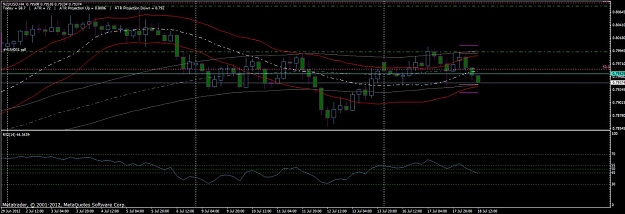
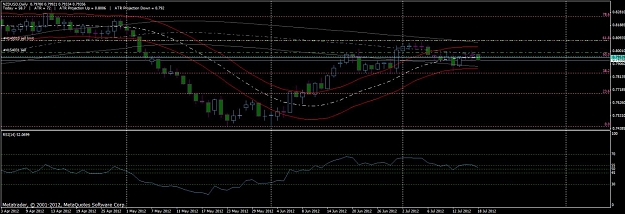
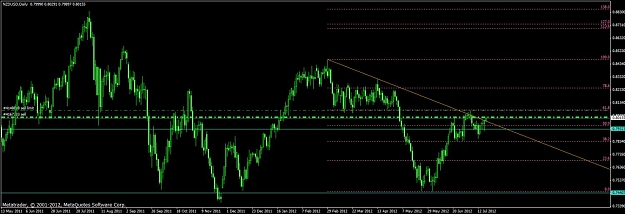
Attached Image(s) (click to enlarge)