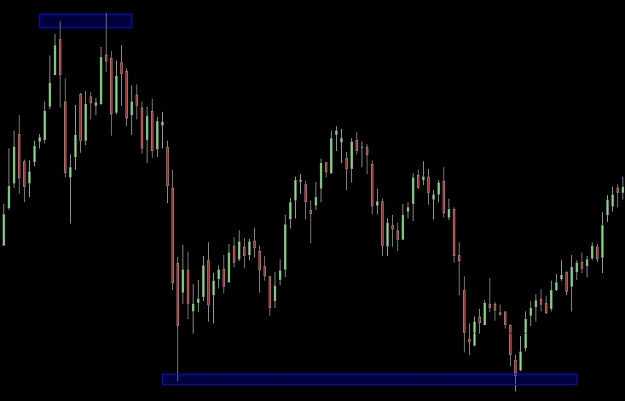
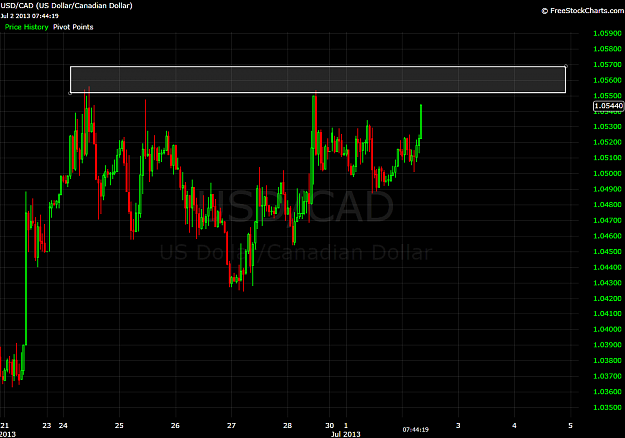
Let me show you what a great short trade will look like with some market structure.
Gbp/Jpy makes another run for recent highs above 133. Last time it rejected these levels showing sellers in control by both longs closing and new shorts entering. Here's what a short opportunity can look like on the Daily chart.
http://i50.tinypic.com/jfu5v6.jpg
& the 1hr:
http://i50.tinypic.com/1zguvt4.jpg
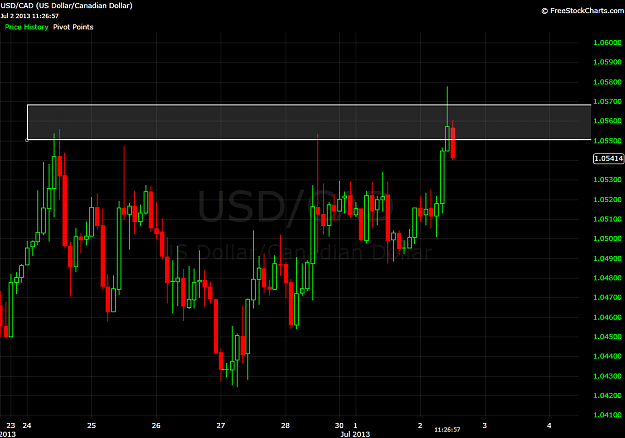
Its another great bull candle on the daily and a strong one on the hourly right in to a resistance level.
Price has been driven up by informed traders, tripping buy stops from eager sellers which entered upon the break of 132. Now above 133, its in a known bear zone.
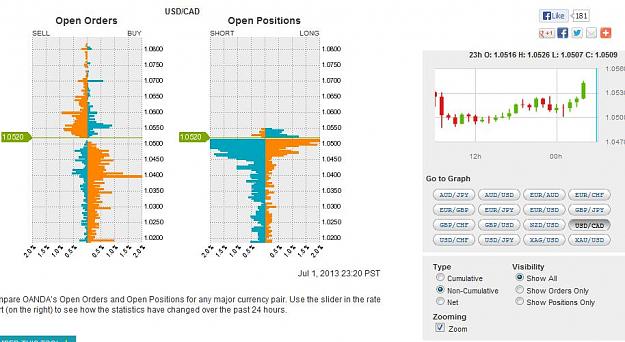
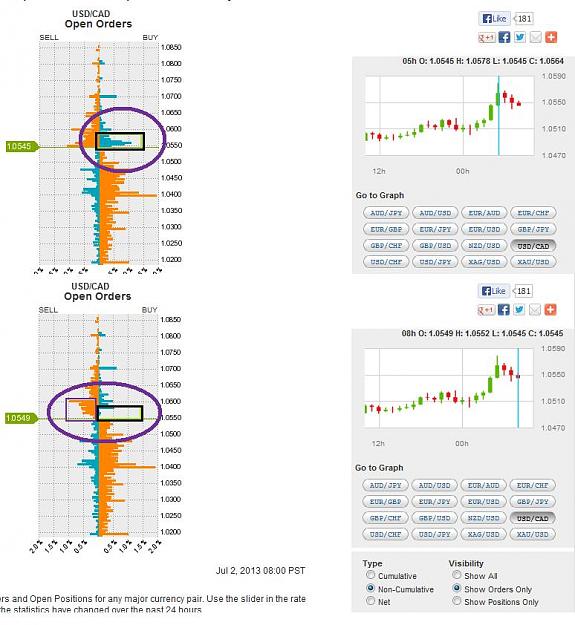
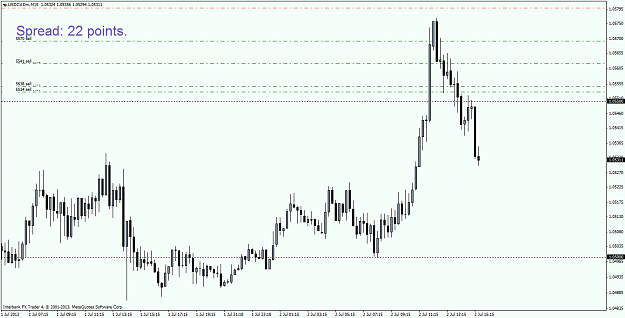
From a retail order book point of view: When price moves up so fast like it has been in the 1hr chart, its not only from shorts exiting with buy stops, but UNinformed traders entering with market orders to catch the move. As with all lagging indicators from some derivitive of price, these retail traders are entering on a trigger based on a strategy. The root of the strategy is price action which triggers from a higher high somewhere, some time frame. So we've also got a bunch of retail guys long in the market. Where would YOU place a stop in this chart if you went long during that spike up?
http://i48.tinypic.com/jra0qh.jpg
I'm trying to save rookie's time by exersizing your mind on how a market moves.. since that's the only way to profit via retail speculation. Relying on indicators for trades is not the way to go. The above is an example on how a professional can take advantage of this.
Gbp/Jpy makes another run for recent highs above 133. Last time it rejected these levels showing sellers in control by both longs closing and new shorts entering. Here's what a short opportunity can look like on the Daily chart.
http://i50.tinypic.com/jfu5v6.jpg
& the 1hr:
http://i50.tinypic.com/1zguvt4.jpg
Its another great bull candle on the daily and a strong one on the hourly right in to a resistance level.
Price has been driven up by informed traders, tripping buy stops from eager sellers which entered upon the break of 132. Now above 133, its in a known bear zone.
From a retail order book point of view: When price moves up so fast like it has been in the 1hr chart, its not only from shorts exiting with buy stops, but UNinformed traders entering with market orders to catch the move. As with all lagging indicators from some derivitive of price, these retail traders are entering on a trigger based on a strategy. The root of the strategy is price action which triggers from a higher high somewhere, some time frame. So we've also got a bunch of retail guys long in the market. Where would YOU place a stop in this chart if you went long during that spike up?
http://i48.tinypic.com/jra0qh.jpg
I'm trying to save rookie's time by exersizing your mind on how a market moves.. since that's the only way to profit via retail speculation. Relying on indicators for trades is not the way to go. The above is an example on how a professional can take advantage of this.