DislikedHB, When you get back a couple questions - cant quite visualize - I am going to set up a pair with these perimeters now... But,
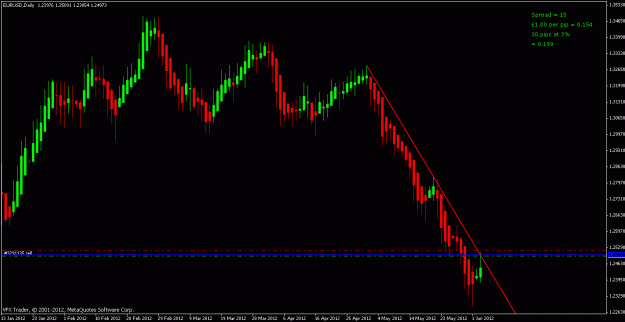
So just S&R lines on the daily - any use for FIB or channels?
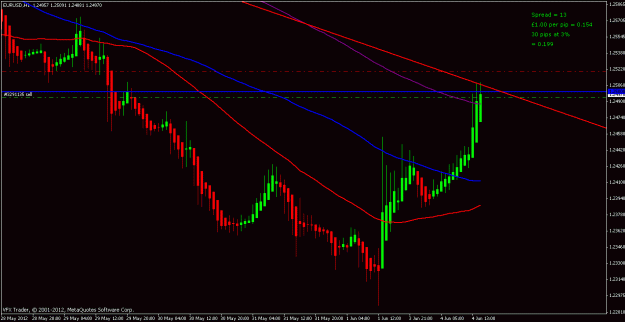
Are we looking for crosses on the 50,100 and 200 ?Ignored
The ma's on the hourly chart are not for crosses but more as a guide to where to take trades and add on. I'm thinking the first break of the 200 sma could be the first trade with a small stop and then each pullback to the 50 sma is the place to add on. Generally in a good trend the price will stay below the 50. A pullback to the 100 signifies a weakening of the trend but a bounce from the 100 can be a good trade. A pullback to the 200 is a major pause in the trend and possible reversal but bounces from the 200 can be good trades too as you can often get in with quite a tight stop.
As the strategy is to add on and only close the pyramid position when a technical level such as an ma is broken then using these levels as add on points and getting to break even quickly seems like the way to go.
Take a look at any pair and identify a trendline break then go to the hourly and see how your strategy of trading the first cross of the 200 sma and adding on at each retrace would have worked out. I'm thinking of using the 100 sma as the initial stop but if the trend develops quickly then I would move the stops to behind the 50 sma so as not to give so much back on a retrace.