~Welcome to Synergy CRS~
I have been working on a new system I've developed and to see if any of the coders extraordinaire wanted to have a challenge in coding this monster.
The method was constructed using a few basic fundamentals of the strategies I had developed on FF and from a few other threads that had peaked my interest from a long time ago, the SRDC I and the Indicator Free trading - Skunny threads. The goal was to create a system that would balance itself out utilizing different styles of trading and types of trades all in one strategy. This strategy is pretty complex with multiple entry possibilities, various trade types and sizes, and multiple exit strategies. Unless an EA can be developed, this strategy will require some screen time. I also utilize some of my semi-martingale progressions in this strategy, so if you follow my MM, make sure to use a properly capitalized account for trading.
First, let's break down the name : Synergy CRS
Synergy is defined in the dictionary as:
Syn-er-gy -noun- the interaction of elements that when combined produces a total effect that is greater than the sum of the individual elements, contributions, etc.
This basically means that each individual part of the strategy works in conjunction with the others to make the strategy flow smoother and promotes better profitability.
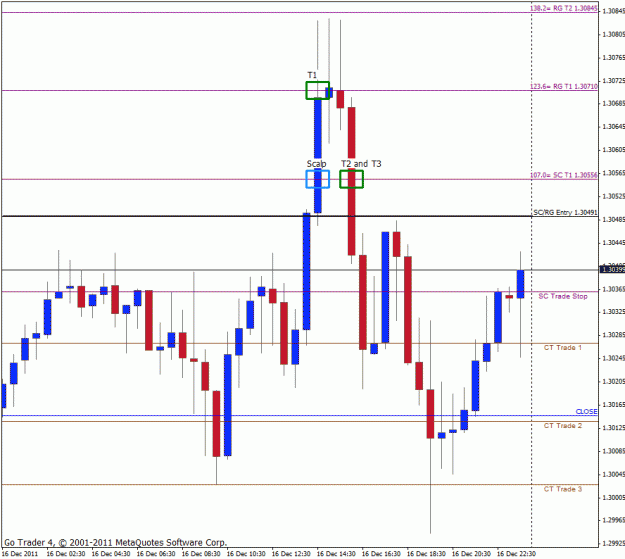
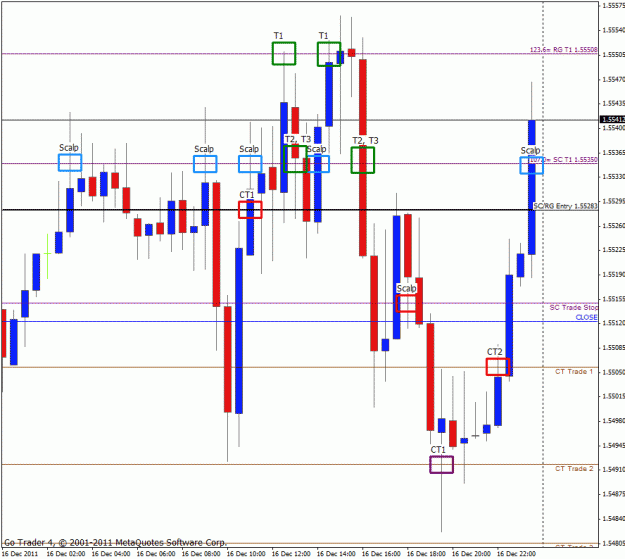
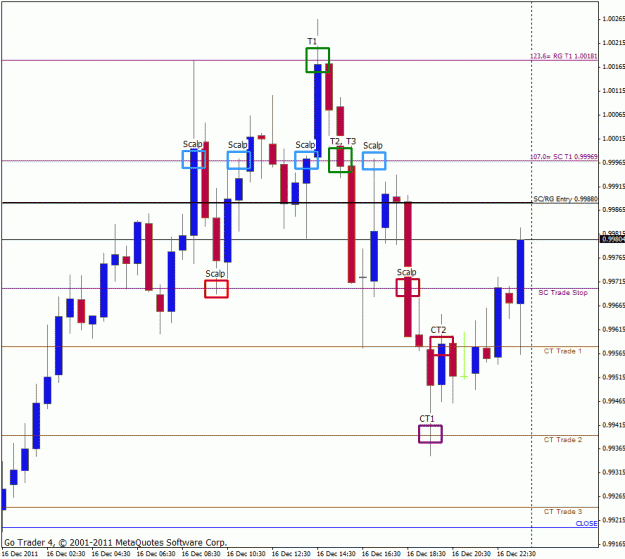
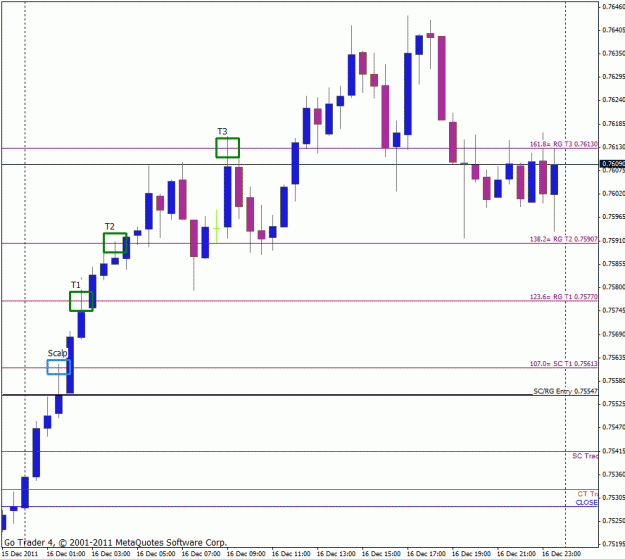
The CRS is an acronym of the three types of trades that make up the overall strategy:
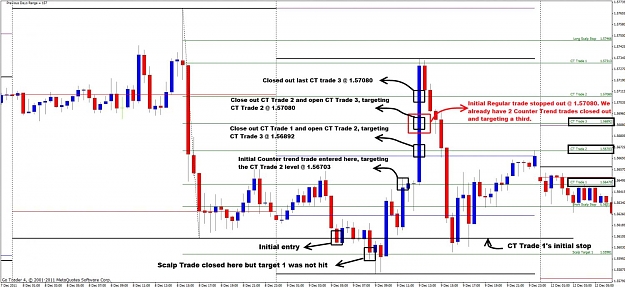
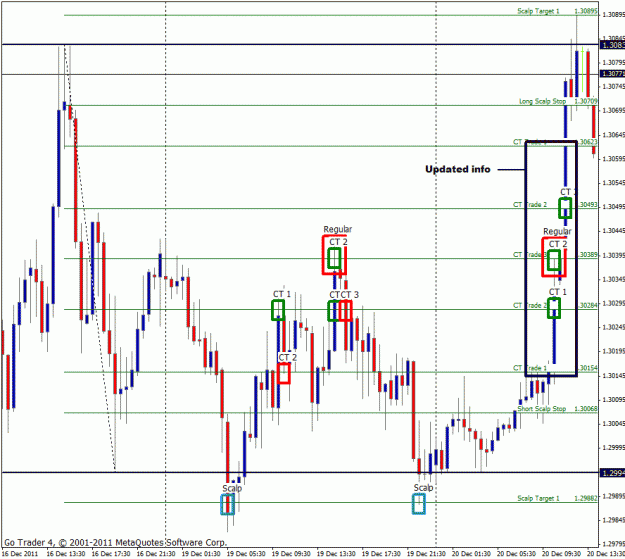
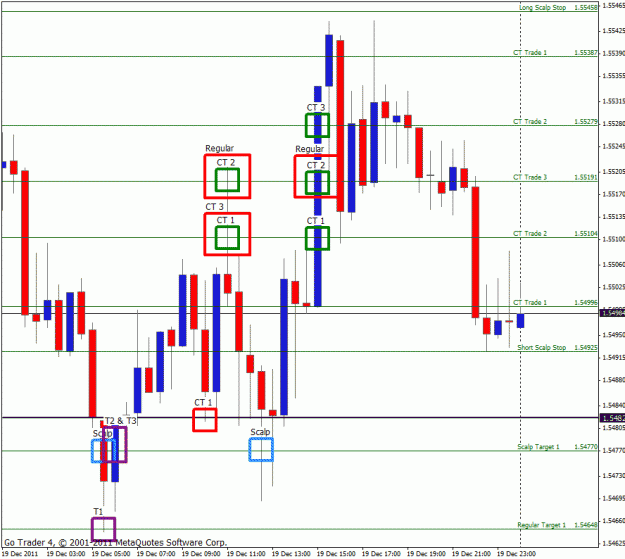
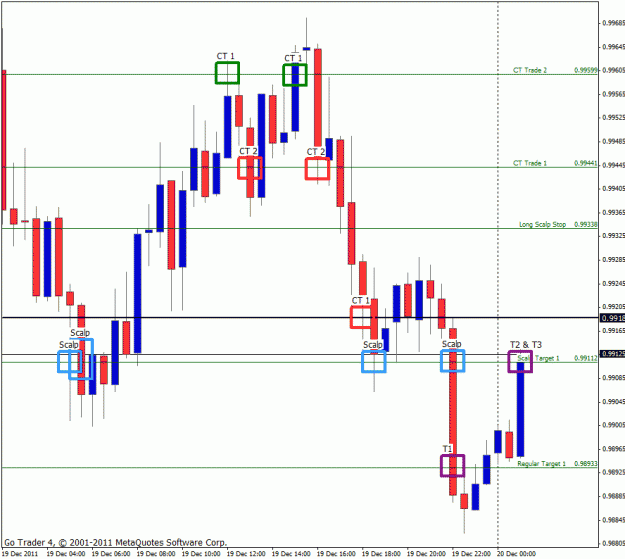
C= Counter Trend Trade
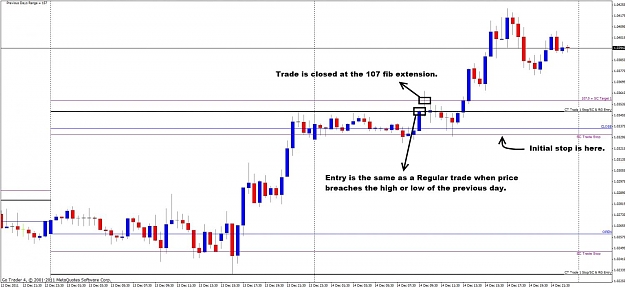
R= Regular Trade
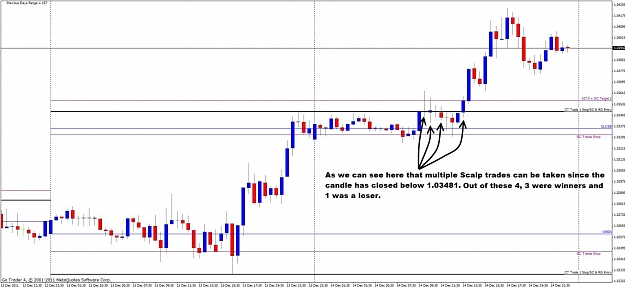
S= Scalp Trade
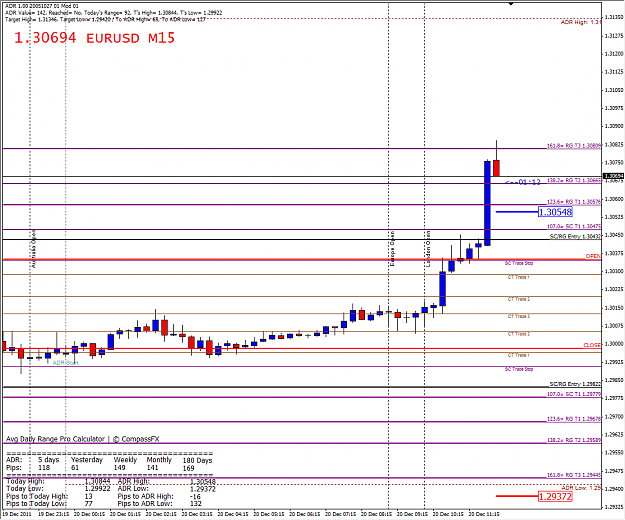
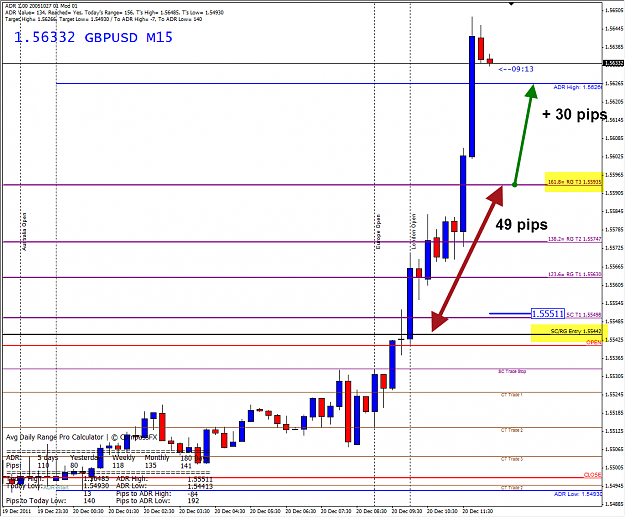
The main tool of the strategy that everything else is based around is the OHLC Indicator with Fib Extensions. This indicator determines the OHLC of the previous day and plots those lines into the current day. The indicator also helps you determine if the previous day's candle was Bullish or Bearish by coloring the Open and Close lines to match the candle color, Blue is Bullish and Red is Bearish. When the current day closes, the indicator takes the current day's OHLC data and redraws the values for the next day's trading. Any previous day's OHLC data is left on the charts for visual testing going back a full 365 days (default) and can be changed in the parameters. The template I added only shows 250 days to limit the size to be able to upload it. The OHLC indicator also plots up to 4 Fibonacci extensions on both sides to be used as targets for the Regular and Scalp trades.
The other two indicators are the Counter Trend Fibs and the Scalp Fibs indicators. The Counter Trend Fibs indicator places lines at key Fibonacci retracement areas, which are the 23.6, 38.2, 50, 61.8, and 76.4 levels. The Scalp fibs indicator is basically the same indicator, but the color is modified and set at the 14 and 86 retracement levels and is basically only used for the Scalp trade Stoploss (more will be explained later). All three indicators are also modified to merge Friday's and Sunday's data for those who have a criminal with a Sunday candle (thanks goes to Miyagi for all the indicators).
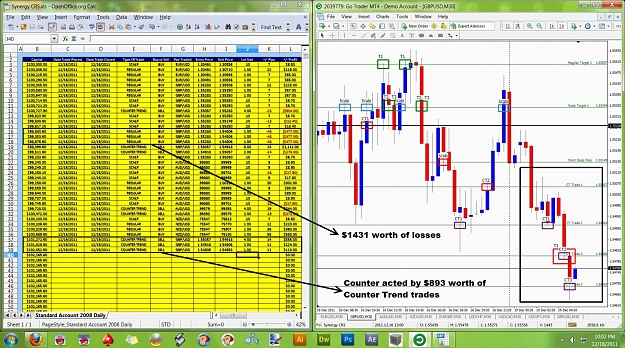
The Regular trades are based on the SRDC I strategy where we are looking for breakouts of the previous day's High or Low and to take advantage of the Fibonacci movements that occur as discussed in Skunny's thread above. The Scalp trades are added in as a quick "in and out" trade to enhance the Regular trades as they're placed at the same time as the Regular trades with a much shorter target, hence the "Scalp" moniker. The Counter Trend trades are there to counter act the losses occurring from the reversals that we will encounter from time to time from the Regular trades, and occasionally, the Scalp trades.
I will be going over each type of trade individually to show how each works and then show everything completely on one chart. On January 1st, 2012, I will be logging trades in an Open Office trade tracker spreadsheet and show every possible trade that could have been taken, whether in profit or a loss. I will be using a Eur/Usd chart using Go Markets for all trade examples after the 1st and have added all the indicators being used for this strategy along with my template for those who wish to be on the same page.
If anyone attempts to make an EA, this one is going to be tricky as the NFA's FIFO and hedging rules are going to play havoc as Scalp and Regular trades will open and close at different times and Counter trend trades will be opened and closed in between Regular trades. Good luck to the coder who wants to tackle this one and I hope everyone enjoys it and can use all or part in their own trading.
***In order to keep true to the original premise of the strategy, please do not post any other indicators or suggestions here on the thread. If this is to be coded, we do not need a wrench to be thrown into the mix. If you have an improvement that works for you, please experiment with it on you own time. This is to lessen any confusion that may occur from clogging the thread with too much additional content. Please make sure to read the whole thread in it's entirety before asking questions as most answers are already in the thread and have been answered, thank you.***
***1/9/2012- I've added the ADR range indicator that Erebus has posted. He is successfully using it in his own way to help with entry points and target calculations and is worth a look. It is not a direct part of the strategy, so if you have any questions on specifically how he uses it in his trading, please PM or e-mail him directly.***
Attached File(s)