• Home
  • Forums
  • Trades
  • News
  • Calendar
  • Market
  • Brokers
  • Login
  • Join
  • User/Email: Password:
  • 8:44pm
Menu
  • Forums
  • Trades
  • News
  • Calendar
  • Market
  • Brokers
  • Login
  • Join
  • 8:44pm
Sister Sites
  • Metals Mine
  • Energy EXCH
  • Crypto Craft

Options

Bookmark Thread

First Page First Unread Last Page Last Post

Print Thread

Similar Threads

Trading Swing by Swing 39 replies

Hagopian Trigger Lines - Andrews Pitchforks 6 replies

swing high/swing low indicator and volume tic history 13 replies

pitchforks 25 replies

Pitchforks in all its glory 73 replies

  • Trading Journals
  • /
  • Reply to Thread
  • Subscribe
  • 2,287
Attachments: Swing trading with Andrew's pitchforks and volume analysis journal
Exit Attachments

Swing trading with Andrew's pitchforks and volume analysis journal

  • Last Post
  •  
  • Page 1 23456 85
  • Page 1 234 85
  •  
  • Post #1
  • Quote
  • First Post: Edited Aug 19, 2014 11:43pm Nov 23, 2011 12:36am | Edited Aug 19, 2014 11:43pm
  •  bayfisherman
  • Joined Nov 2011 | Status: Member | 2,026 Posts
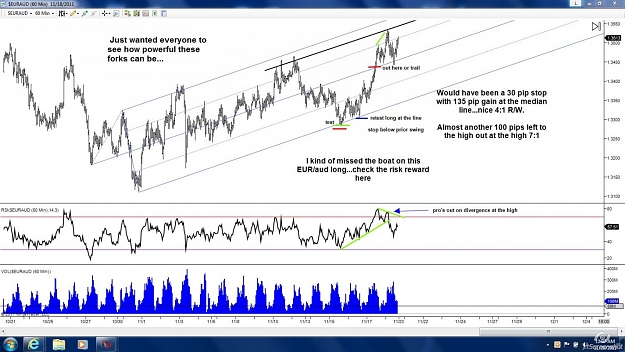
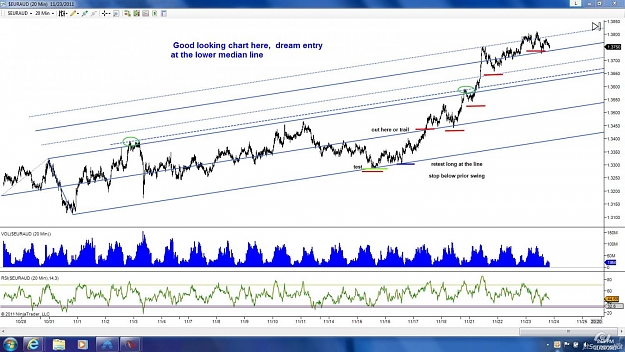
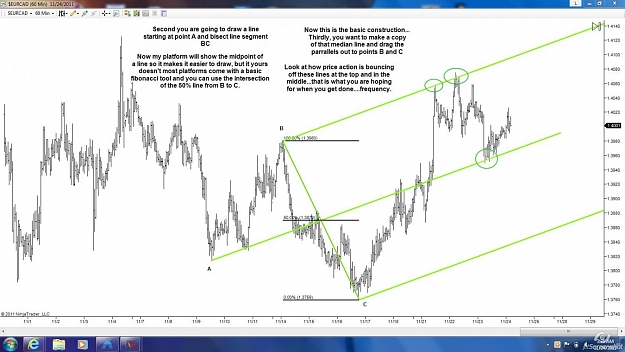
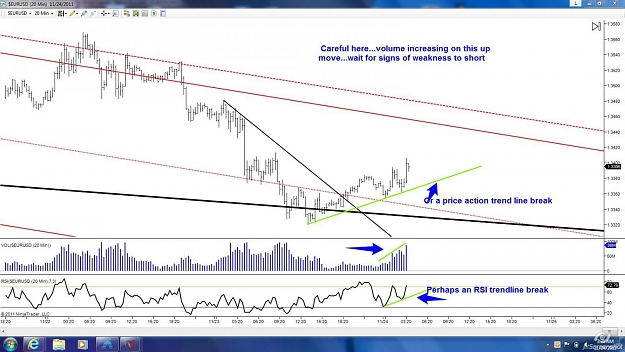
A friend advised me some of you may appreciate looking at some clearly explained charts and analysis...Hope you enjoy. Any comments good or bad are welcomed. I use pitchforks to get the general path of price and trade off them as support and resistance.

Each market has a frequency of it's own, it's just a matter of tuning into it and letting the lines show you the way.

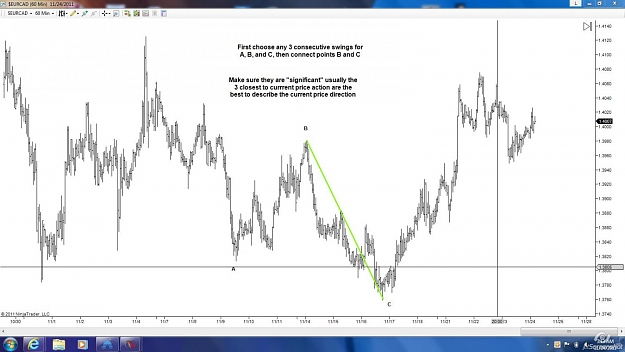
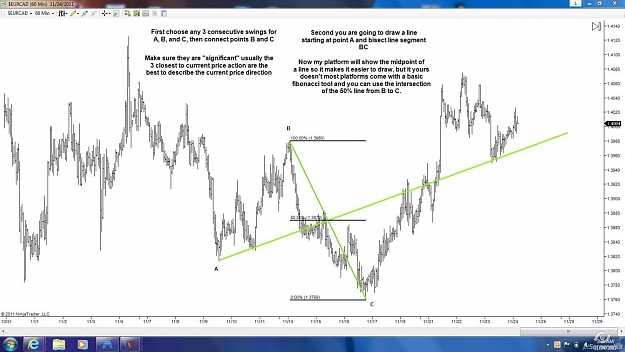
Still looking at volume on a weekly and daily basis, but these harmonic patterns on the 15 and 60m time frames are too consistent to overlook...

-----------------------------------------------

It's been a few years now, things change people grow, new information comes to light, new tools, etc. and what I've come to learn about the markets is that all we can do is try to put the odds in our favor and use good money management. Probability -- we always hear about it but what gives us that probability/edge to successful trading? Basic market dynamics...have to give some props to Barry Burns put it pretty simply. Trend, cycle, momentum, supp/resis and fractal. These are all pieces of market dynamics that gives your trade probability...even if the stars align and you're doing 80+% trading putting the probabilities on your side, you are still going to fail/get stopped out 20% of the time. Now put that on a scale 100 trades...what are you going to do when those 20 losing trades line up together (drawdown) -- UHH, you just have to know it's part of the game and can you deal with it mentally so that you can get in there to enjoy the 80% winners. Psychology plays a huge role in successful trading. Tim Morge says it pretty well, Master yourself. Discipline, do you have it...even when it hurts during drawdown? Just some food for thought...good trading all.
  • Post #2
  • Quote
  • Nov 23, 2011 12:47am Nov 23, 2011 12:47am
  •  bayfisherman
  • Joined Nov 2011 | Status: Member | 2,026 Posts
Quoting bayfisherman
Disliked
A friend advised my some of you may appreciate looking at some clearing explained chart analysis...Hope you enjoy. Any comments good or bad are welcomed. I use pitchforks to get the general path of price and trade off them as support and resistance.

Each market has a frequency of it's own, it's just a matter of tuning into it and letting the lines show you the way. Volume analysis at those areas will help determine whether or not the line is valid or not at that particular time.

Here's a quick sample of the power of these forks..

http://my.jetscreenshot.com/demo/20111123-cvld-250kb...
Ignored
Here's the screenshot sorry about the link...
Attached Image (click to enlarge)
Click to Enlarge

Name: EURaussie60min.jpg
Size: 154 KB
 
 
  • Post #3
  • Quote
  • Nov 23, 2011 1:00am Nov 23, 2011 1:00am
  •  bayfisherman
  • Joined Nov 2011 | Status: Member | 2,026 Posts
It's late and I just threw this up there but there will be plenty more to come. Feel free to send any questions my way. I enjoy the banter. Thanks. I've been looking mostly at the USD pairs here lately and I do some correlational stuff with the futures markets in the DX, OIL and ES contracts. For got to mention along with pitchforks and volume I"m looking at some Elliot wave principle and momentum usually RSI. Here's an other one I marked up for my brother since he likes to trade stocks...
Attached Image (click to enlarge)
Click to Enlarge

Name: ES240breakdown.jpg
Size: 205 KB
 
 
  • Post #4
  • Quote
  • Nov 23, 2011 5:42am Nov 23, 2011 5:42am
  •  bayfisherman
  • Joined Nov 2011 | Status: Member | 2,026 Posts
Here's a look at a Modified Schiff fork on the EU.
Attached Image (click to enlarge)
Click to Enlarge

Name: EU 120 min.jpg
Size: 186 KB
 
 
  • Post #5
  • Quote
  • Nov 23, 2011 5:55am Nov 23, 2011 5:55am
  •  bayfisherman
  • Joined Nov 2011 | Status: Member | 2,026 Posts
usdUCHF? I'm getting up to early for this .... lol.
Attached Image (click to enlarge)
Click to Enlarge

Name: usdUCHF.jpg
Size: 176 KB
 
 
  • Post #6
  • Quote
  • Nov 23, 2011 6:00am Nov 23, 2011 6:00am
  •  Incrediblle
  • | Membership Revoked | Joined Mar 2011 | 1,831 Posts
are u holding any position right now?
Trade responsiblypatience is the key/Swing trader
 
 
  • Post #7
  • Quote
  • Nov 23, 2011 6:11am Nov 23, 2011 6:11am
  •  bayfisherman
  • Joined Nov 2011 | Status: Member | 2,026 Posts
Quoting Incrediblle
Disliked
are u holding any position right now?
Ignored
yes I will probably hold this one through the weekend if possible.
 
 
  • Post #8
  • Quote
  • Nov 23, 2011 7:06am Nov 23, 2011 7:06am
  •  Pipbumper
  • | Joined Jun 2011 | Status: Member | 529 Posts
some upward movement if possible, take care and choose the short right. I would not jump in short before at least 1.3420, better at 1.3450 depending on pa
 
 
  • Post #9
  • Quote
  • Nov 23, 2011 7:23am Nov 23, 2011 7:23am
  •  bayfisherman
  • Joined Nov 2011 | Status: Member | 2,026 Posts
Really don't know what to think about that other thread...is it always like that?

I appreciate some actual constructive feedback. That other stuff is a joke.
 
 
  • Post #10
  • Quote
  • Nov 23, 2011 8:25pm Nov 23, 2011 8:25pm
  •  bayfisherman
  • Joined Nov 2011 | Status: Member | 2,026 Posts
Definitely technical signs of a bounce as price moves up how high?... I don't know. I've started using sell stop orders under market as price rises in this down trend on lower volume and caught the trendline break selloff...Using 20 pip initial stop and 20 pip trailing, especially if I'm crashing over night to give it some room....and it's worked out pretty well so far till the morning when I can manually put my stop where I like.

I'm short the EU currently and long the usdCHF, and usdJPY...missed the turn tonight in the yen...that trade has really trickled along and finally made some nice gains today just to give it all back tonight...intervention anyone?
Attached Image (click to enlarge)
Click to Enlarge

Name: EU update.jpg
Size: 163 KB
 
 
  • Post #11
  • Quote
  • Nov 23, 2011 8:43pm Nov 23, 2011 8:43pm
  •  bayfisherman
  • Joined Nov 2011 | Status: Member | 2,026 Posts
looking like the other usd pairs potential pullback here...
Attached Image (click to enlarge)
Click to Enlarge

Name: Cad update.jpg
Size: 167 KB
 
 
  • Post #12
  • Quote
  • Nov 23, 2011 8:51pm Nov 23, 2011 8:51pm
  •  bayfisherman
  • Joined Nov 2011 | Status: Member | 2,026 Posts
this trade has been very fickle...not much luck with yen, but I'm still holding by long position...potential long off trendline support tonight.
Attached Image (click to enlarge)
Click to Enlarge

Name: jpy update.jpg
Size: 125 KB
 
 
  • Post #13
  • Quote
  • Nov 23, 2011 8:57pm Nov 23, 2011 8:57pm
  •  bayfisherman
  • Joined Nov 2011 | Status: Member | 2,026 Posts
Short aussie on pullbacks...very weak this one.
Attached Image (click to enlarge)
Click to Enlarge

Name: aussie update.jpg
Size: 154 KB
 
 
  • Post #14
  • Quote
  • Nov 23, 2011 9:01pm Nov 23, 2011 9:01pm
  •  bayfisherman
  • Joined Nov 2011 | Status: Member | 2,026 Posts
This one looks weak as well...stay short sell rallies.
Attached Image (click to enlarge)
Click to Enlarge

Name: kiwi update.jpg
Size: 163 KB
 
 
  • Post #15
  • Quote
  • Nov 23, 2011 9:05pm Nov 23, 2011 9:05pm
  •  bayfisherman
  • Joined Nov 2011 | Status: Member | 2,026 Posts
like all the rest downtrend well intact...look to sell rallies on lower volume at resistance.
Attached Image (click to enlarge)
Click to Enlarge

Name: pound update.jpg
Size: 183 KB
 
 
  • Post #16
  • Quote
  • Nov 23, 2011 9:18pm Nov 23, 2011 9:18pm
  •  bayfisherman
  • Joined Nov 2011 | Status: Member | 2,026 Posts
woulda coulda shoulda...lines are still in play here.
Attached Image (click to enlarge)
Click to Enlarge

Name: EURaud update.jpg
Size: 160 KB
 
 
  • Post #17
  • Quote
  • Nov 23, 2011 9:22pm Nov 23, 2011 9:22pm
  •  bayfisherman
  • Joined Nov 2011 | Status: Member | 2,026 Posts
I use ninja trader...you reall need one with all the functionality or you are just going to be spinning your wheels...
Attached Image (click to enlarge)
Click to Enlarge

Name: Pitchfork platform.jpg
Size: 172 KB
 
 
  • Post #18
  • Quote
  • Nov 23, 2011 11:53pm Nov 23, 2011 11:53pm
  •  bumapatria
  • Joined Aug 2011 | Status: Member | 10,724 Posts
hey sir, perhaps u can show us a method to draw one manually?

thank you, id love to see your trades based on it
Have I got something on my face, SOLDIER?
 
 
  • Post #19
  • Quote
  • Nov 24, 2011 4:29am Nov 24, 2011 4:29am
  •  bayfisherman
  • Joined Nov 2011 | Status: Member | 2,026 Posts
1st you need to pick out your A.B and C points and those can be any 3 consecutive swing points on any time frame actually. I suggest using anything from the 20 min time frame and up...

A downsloping fork you will pick swings from A the high to B the next swing low, then C the next significant swing high and the reversal will be true for an upsloping fork....swing low, swing high, swing low. You will use your line segment tool to draw a straight line from point B to C, then another one from point A through the midpoint of line segment BC...that will be your slope of the fork and "median line". Now you can simply copy that line and drag a parrallel out to each swing at points B and C so you have your pitchfork configuration. Now finding the midpiont of BC may be difficult if you don't have something to measure that, but I've used my fibonnacci tool before simply drag it from B to C and the intersection of the 50% line over BC will give you the midpoint.
Attached Images (click to enlarge)
Click to Enlarge

Name: first.jpg
Size: 107 KB Click to Enlarge

Name: second.jpg
Size: 121 KB Click to Enlarge

Name: third.jpg
Size: 129 KB
 
 
  • Post #20
  • Quote
  • Nov 24, 2011 4:47am Nov 24, 2011 4:47am
  •  bayfisherman
  • Joined Nov 2011 | Status: Member | 2,026 Posts
EU is pulling back nicely I would wait till volume slows or you get a trendline break to add to short.
Attached Image (click to enlarge)
Click to Enlarge

Name: EU update.jpg
Size: 141 KB
 
 
  • Trading Journals
  • /
  • Swing trading with Andrew's pitchforks and volume analysis journal
  • Reply to Thread
    • Page 1 23456 85
    • Page 1 234 85
0 traders viewing now
  • More
Top of Page
Forex Factory Blog Updated: Alerting All Members
  • Facebook
  • Twitter
About FF
  • Mission
  • Products
  • User Guide
  • Media Kit
  • Blog
  • Contact
FF Products
  • Forums
  • Trades
  • Calendar
  • News
  • Market
  • Brokers
  • Trade Explorer
FF Website
  • Homepage
  • Search
  • Members
  • Report a Bug
Follow FF
  • Facebook
  • Twitter

FF Sister Sites:

  • Metals Mine
  • Energy EXCH
  • Crypto Craft

Forex Factory® is a brand of Fair Economy, Inc.

Terms of Service / ©2022