• Home
  • Forums
  • Trades
  • News
  • Calendar
  • Market
  • Brokers
  • Login
  • Join
  • User/Email: Password:
  • 7:31pm
Menu
  • Forums
  • Trades
  • News
  • Calendar
  • Market
  • Brokers
  • Login
  • Join
  • 7:31pm
Sister Sites
  • Metals Mine
  • Energy EXCH
  • Crypto Craft

Options

Bookmark Thread

First Page First Unread Last Page Last Post

Printable Version

Similar Threads

Fozzy-style trading techniques 30 replies

What is your trading style (when not trading data) 24 replies

Help please - broker V trading style 0 replies

Non-hedge Grid Style Trading and Money Management 30 replies

Trading Style & Leverage 12 replies

  • Trading Discussion
  • /
  • Reply to Thread
  • Subscribe
  • 163
Attachments: Articulate's MasterCharts Trading Style
Exit Attachments

Articulate's MasterCharts Trading Style

  • Last Post
  •  
  • Page 1 23456 9
  • Page 1 234 9
  •  
  • Post #1
  • Quote
  • First Post: Oct 29, 2011 6:26am Oct 29, 2011 6:26am
  •  Articulate
  • Joined Jun 2009 | Status: Member | 822 Posts
What I will discussing here over the next few years is what I will the MasterCharts trading style. This trading style was developed over the last three years as my extensive research. I believe I should share the end product here for the benefit of others.

Here are the key issues in the trading style that I will discuss here:

1. The Mastercharts for major currency pairs
2. How to trade the mastercharts for long, medium and short-term trading
3. Practical trading using the Mastercharts
  • Post #2
  • Quote
  • Oct 29, 2011 8:56pm Oct 29, 2011 8:56pm
  •  Mr.chia
  • | Joined Oct 2011 | Status: Member | 261 Posts
Quoting Articulate
Disliked
What I will discussing here over the next few years is what I will the MasterCharts trading style. This trading style was developed over the last three years as my extensive research. I believe I should share the end product here for the benefit of others.

Here are the key issues in the trading style that I will discuss here:

1. The Mastercharts for major currency pairs
2. How to trade the mastercharts for long, medium and short-term trading
3. Practical trading using the Mastercharts
Ignored
i will waiting for your extensive research for add my trading knowlegde,
thank you very much, articulate.may God Bless You
  • Post #3
  • Quote
  • Oct 30, 2011 12:39am Oct 30, 2011 12:39am
  •  CowLee
  • | Joined Oct 2011 | Status: Member | 26 Posts
i'm in.
  • Post #4
  • Quote
  • Oct 30, 2011 10:13am Oct 30, 2011 10:13am
  •  bhupinder
  • | Joined Apr 2004 | Status: Member | 86 Posts
count me in.Looking forward to learning from you. Thanks for starting the thread.
  • Post #5
  • Quote
  • Nov 4, 2011 7:57am Nov 4, 2011 7:57am
  •  Articulate
  • Joined Jun 2009 | Status: Member | 822 Posts
Trading requires careful preparation and insightful analysis. This could be overwhelming and confusing to majority of traders. The truth of the matter is that most traders are incapable of undertaking the complex technical analysis required for informed decisions. The fundamental analysis is a different challenge entirely. I read somewhere that you need 100,000 hours of study to fully understand forex trading. Let me tell you the truth, this statement though slightly exagerated might not be very far from the truth.

However, as a resulf of my researches over the last few years, I have narrowed down this complex endeavour into some simple, easy to understand strategy. As a result of these research efforts I have been to develop my unique trading strategy comprising of the following key styles:

a) Mastercharts
b) Concrete Zone Trading system
c) 14 days period Daily RSI
c) 1000 Pips Price Action Analysis (1000 pips PAA)
d) 50 Pips Price Action Analysis (50 pips PAA), etc
These keys styles could be found in my main thread - The Perfect Trading System, you can search for it on FF. On the thread I discussed my general views on forex trading.

I considered it necessary to separate the mastercharts from all these styles due to its strenght. I also consider Mastercharts as classical charts that could guide a trade for several years. Furthermore, since I have found the usage of Mastercharts very successful by me and my team, I consider it necessary to continue the research by allowing others to use this style and gauge their successes through their postings here. I will only discuss mastercharts here and nothing else.

The major characteristic of Mastercharts are as follows:

a) The circles of most currencies pairs are between (6000 - 9000 pips)
b) The major resistance/support levels are usually 1000 pips apart
c) The minor resistance/support levels are mostly 500 pips apart and 750 pips for AUDUSD, which circle is 1500 pips.

Read the links below for on the mastercharts for the following pairs and how to use the Mastercharts for day, short, medium and long term trading. Replicate the charts for the pairs you trade on your trading platform, follow this thread for regular updates on the style.

Your questions, comments, views, criticisms or observations are welcome. I will try to respond to queries/comments as time permits. What I will not allow here is abusive/derogatory/inciting/disrepectful behaviours. Let us all be civilised and courteous in our conduct.

The intention of the thread is to achieve continuous improve of the Masterchart trading style.

I formally welcome you to the thread!


GBPUSD
http://www.forexfactory.com/showthre...19#post4663419

GBPJPY
http://www.forexfactory.com/showthre...07#post4689307

EURUSD
http://www.forexfactory.com/showthre...17#post4675317

AUDUSD
http://www.forexfactory.com/showthre...73#post4656573

USDCAD
http://www.forexfactory.com/showthre...66#post4694266

USDJPY
http://www.forexfactory.com/showthre...38#post5102338

GBPCAD, NZDUSD, GBPAUD,AUDNZD
http://www.forexfactory.com/showthre...51#post5077551

USDCHF
http://www.forexfactory.com/showthre...98#post4698598

GBPCHF
http://www.forexfactory.com/showthre...10#post4694910

AUDJPY
http://www.forexfactory.com/showthre...81#post4694681

How to use the MasterCharts:
http://www.forexfactory.com/showthre...07#post4813307
http://www.forexfactory.com/showthre...44#post4813344
http://www.forexfactory.com/showthre...57#post4813357
http://www.forexfactory.com/showthre...86#post4813486
http://www.forexfactory.com/showthre...90#post4813390
http://www.forexfactory.com/showthre...67#post4813367
  • Post #6
  • Quote
  • Jan 16, 2012 8:49am Jan 16, 2012 8:49am
  •  Articulate
  • Joined Jun 2009 | Status: Member | 822 Posts
I will discuss monthly price action analysis in relation to the Masterchart for a better understanding of the forex market, I will post the monthly charts for the GBPUSD, GBPJPY, EURUSD, USDJPY and will use GBPUSD to explain what monthly price action analysis is all about.

Happy reading!

Attached Images (click to enlarge)
Click to Enlarge

Name: 2012 monthly chart  -  gbpusd.gif
Size: 18 KB Click to Enlarge

Name: 2012 monthly chart  -  gbpjpy.gif
Size: 18 KB Click to Enlarge

Name: 2012 monthly chart  -  eurusd.gif
Size: 21 KB Click to Enlarge

Name: 2012 monthly chart  -  usdjpy.gif
Size: 20 KB
  • Post #7
  • Quote
  • Jan 16, 2012 8:52am Jan 16, 2012 8:52am
  •  Articulate
  • Joined Jun 2009 | Status: Member | 822 Posts
Successes in forex trading could only be achieved if you have the bigger picture within your purview. To achieve this it is important to realise that you can only have a ‘helicopter view’ of the market in the higher time frames. The higher time frames provide useful insights into the trading parameters within a given period of time, which could be up to 2-4 years. With this knowledge it becomes easier to proceed to the lower time frames and trade confidently within the established boundary.

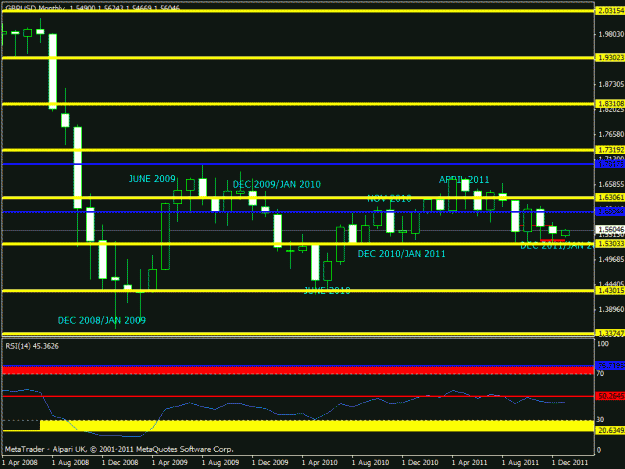
For a better understanding of the picture, we will now discuss, the Monthly Price Action Analysis (MPAA). As usual we will use the GBPUSD monthly to explain the MPAA for the period December 2008 – January 2012.


A closer observation of the monthly chart for GBPUSD will reveal the following facts:

a) If the cable begins a new year around the lowest point in a yearly circle, the point usually serve as a circle for a bullish run (rise in price)

b) If the cable begins a new year around the highest point in a yearly circle, the point usually serve as a circle for a bearish run (fall in price)

c) Price moves for the first 6 months (Jan-June), consolidates for the next 3 months (July-Sept), and closes for the last 3 months (Oct-Dec)

d) Price generally consolidate around the concrete zones

The question at this point is what is the usefulness of the above analysis in a simple language? The benefit of the MPAA is that the accounting year for the ‘big players’ (banks, hedge funds, investment outfits, etc) starts from January and ends in December. At the beginning of each year, depending on the fundamental factors, the big players push the price to a direction determined by fundamental factors (it doesn’t matter whether it is bull or bear). By the middle of the year, these players used the next three months see whether the bullish/bearish run will continue or not hence the consolidation around this period. These players use the last three months to take their profit and close their books for the year. The big players will never leave roll over their profit to another year. That is the monthly circle for the Cable.

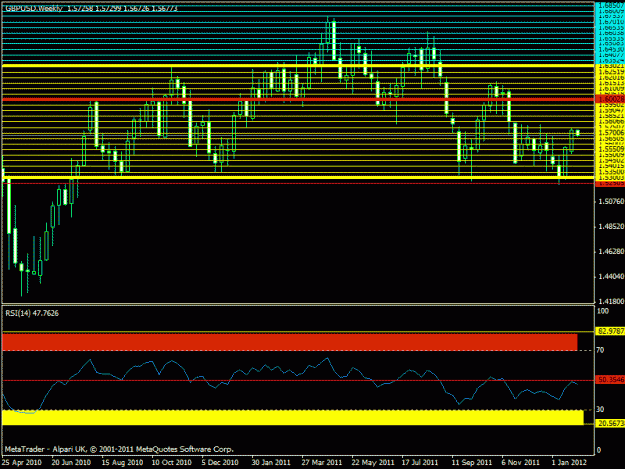
What is then my view for 2012? I.5300 is proving to be a very strong support on all time frames and most importantly the weekly candle. I expect a consolidation around this area before the next major moves, when all the market movers return by the end of this month/1st week of February. Whichever directing they are going, the weekly candles will tell us. Due to the concern with Euro, the sentiment is down but 1.530 has not been broken since August 2008. If the weekly candle breaks out of this zone and the next candle opens and closes below this level, then we should begin to look at for a test of 1.430 which is the next support.

I attach a weekly chart showing consolidation around the master charts levels. This area of weekly consolidation is where I called the concrete zone. The weekly charts can consolidate for up to three months. The consolidation area for now is between 1.5360 and 1.5780 (about 420 pips) and the Masterchart support is 1.530 until firstly, the body of a weekly candle closed outside and secondly a the body of a weekly candle opens and closes outside this level. A pin outside 1.530 is a false breakout.

What I am trying to do here is to explain this process and give you knowledge to apply it to any situation. To gain confidence in your analysis pick the chart for any currency pair e.g. EURUSD, GBPJPY, AUDUSD, and try the MPAA through this simple process:

Ø Identify where the prices on the monthly chart are in Dec/Jan over a period of 2-3 years
Ø Identify the highest and lowest point for 2-3 years
Ø Identify weekly chart price reaction around the concrete zone
Ø Identify the consolidation areas (concrete zone)

You can post your charts here and I will endeavour, I will review them and tell you where you need to improve.

I attach the monthly for GBPUSD in support of MPAA and the weekly, daily, H4 and even H1 charts to show price reaction within our current 400 pips concrete zone.
50PPAA will tell you the immediate direction and read the mindset of a successful trader to know how to react to what you see in our charts.

I wish you successful trading in 2012.
Attached Images (click to enlarge)
Click to Enlarge

Name: 2012 concrete   -  gbpusd 400 pips.gif
Size: 15 KB Click to Enlarge

Name: 2012 concrete   -  daily gbpusd 400 pips.gif
Size: 19 KB Click to Enlarge

Name: 2012 concrete   -  h4 gbpusd 400 pips.gif
Size: 21 KB Click to Enlarge

Name: 2012 concrete   -  h1 gbpusd 400 pips.gif
Size: 23 KB
  • Post #8
  • Quote
  • Jan 28, 2012 10:38am Jan 28, 2012 10:38am
  •  Articulate
  • Joined Jun 2009 | Status: Member | 822 Posts
Let me quote the opening paragraph of the post on MPAA above "Successes in forex trading could only be achieved if you have the bigger picture within your purview."


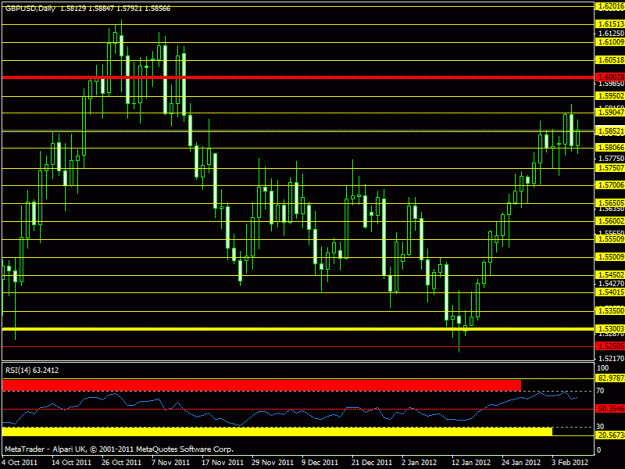
Check the weekly chart for the cable and see how it looks. The weekly candles currently sits pretty well on the Masterchart level of 1.530 which has not be broken since 2008. The daily candle has been been on bullish run non-stop for the last 10 days. The barrier to the bull is the concrete zone barrier at 1.5780, which is the area to watch out for. The question at this point is will the weekly candle break this barrier and continue the run? The 50PAA on H4 chart will give you the advance signal. Count the numbers of weekly, daily and H4 candles that urrently sit on 1.530 to appreciate the reliability of this analysis. 1.530-1.5780 is still our concrete zone, a break either way by the weekly candle will confirm the direction between now and the middle of the year.

This is the superior way of looking at the market.

As usual see the daily and H4 candles showing the 50PPAA.

Enjoy your weekend!


Quote:
Originally Posted by Articulate http://www.forexfactory.com/images/buttons/viewpost.gif
[font=Tahoma]What is then my view for 2012? I.5300 is proving to be a very strong support on all time frames and most importantly the weekly candle. I expect a consolidation around this area before the next major moves, when all the market movers return by the end of this month/1st week of February. Whichever directing they are going, the weekly candles will tell us. Due to the concern with Euro, the sentiment is down but 1.530 has not been broken since August 2008. If the weekly candle breaks out of this zone and the next...

Post hidden because Articulate is on your ignore list.


Attached Thumbnailshttp://www.forexfactory.com/attachme...1&d=1327763965 http://www.forexfactory.com/attachme...1&d=1327763965
  • Post #9
  • Quote
  • Feb 1, 2012 9:00am Feb 1, 2012 9:00am
  •  Articulate
  • Joined Jun 2009 | Status: Member | 822 Posts
What I will discuss today is how to identify the top and bottom on the weekly chart (which I referred to as nN, mM, Vv, Uu and Ww). The discussion will revolves specifically around steps 3 of my posting on the mindset of a successful trader.

Trained eyes will easily recognise these alphabets on a weekly candlesticks chart. However, an inexperienced trader will get a better picture using a line chart. The advantage of candlesticks chart is that the weekly pins will be visible and this allows for a more precise analysis and opportunity to enter trades at a better discounts. That notwithstanding the end result will be basically be same.

See the attached weekly candlesticks and line charts and identify nN, mM, Vv, Uu and Ww) on the charts.

There is an excellent chance of success, if these signs are used in conjunction with 1000PPAA and Masterchart levels. The question at this point is "How many traders have the discipline to wait for the right set-up?

With a different approach. trading could be much easier.

The link to the full postiing on the Mindset of a successful trader is pasted here.


http://www.forexfactory.com/showthre...211973&page=21
Attached Images (click to enlarge)
Click to Enlarge

Name: gbpusd 2012 - msns - candles.gif
Size: 18 KB Click to Enlarge

Name: gbpusd 2012 - msns.gif
Size: 15 KB
  • Post #10
  • Quote
  • Feb 9, 2012 9:29am Feb 9, 2012 9:29am
  •  Articulate
  • Joined Jun 2009 | Status: Member | 822 Posts
Quoting Articulate
Disliked
Let me quote the opening paragraph of the post on MPAA above "Successes in forex trading could only be achieved if you have the bigger picture within your purview."


[font=Tahoma]Check the weekly chart for the cable and see how it looks. The weekly candles currently sits pretty well on the Masterchart level of 1.530 which has not be broken since 2008. The daily candle has been been on bullish run non-stop for the last 10 days. The barrier to the bull is the concrete zone barrier at 1.5780, which is the area to watch out...
Ignored

1.530 held as a strong support. So far it appears the "big players" are trying to attack the masterchart level at 1.630, but 1.600 (psychological barrier) is the first obstacle. From 1.270 t0 1.592 is 528 pips so far. Will they complete the 1000 pips movement at once or will there be a pullback before completing the move? Time will tell. But what I know is that as far as the weekly chart is concerned, the bull are still in charge.

Can a trader join the train now? It is too late for any long term trade, but if you are looking for around 50 pips per trade, look for retrace on 50PPAA. If at least three H4 candles fail to break a level, join the 4th one for the continuation of the bullish run.

It is always better to have a strategic view of the market!

I attach the daily and H4 charts in support of the above analysis.
Attached Images (click to enlarge)
Click to Enlarge

Name: gbpusd-daily february.gif
Size: 19 KB Click to Enlarge

Name: gbpusd-h4- february.gif
Size: 16 KB
  • Post #11
  • Quote
  • May 15, 2012 5:17am May 15, 2012 5:17am
  •  Articulate
  • Joined Jun 2009 | Status: Member | 822 Posts
Quoting Articulate
Disliked
1.530 held as a strong support. So far it appears the "big players" are trying to attack the masterchart level at 1.630, but 1.600 (psychological barrier) is the first obstacle
Ignored
1000 PIPs PPICE ACTION ANALYSIS

Let us discuss an update of 1000 PPAA. The cable completed its 1000 pips movement from 1.6279 (1045 pips) on Friday, April 27, 2012. The journey from Jan 8 to April 27, 2012 took 3 months and 20 days, 15 weeks and 4 months of continuous bullish run. The weekly sat on 1.5300 and touched 1.6300.

The monthly chart clearly shoes that the ‘big guys’ have been going long (buy) since the beginning of the year. The weekly chart also shows attempts by the ‘big players’ to deceive the small players that the bullish trend has changed bearish. As you can see from the weekly chart the bearish moves were first stopped by the support around 1.5650, the support the shifted to 1.5800 and finally shifted to 1.6050.

The next question is after 1000 pips what next? Shift your attention to the Daily Friendly Chart. What did you see? The chart is telling us that it is time to begin to look for opportunities to sell at least until the daily RSI returns to around 50 points point .

My view is that between 1.6250 and 1.6300 is the ideal place to look for short. This is because after 1000 pips, some of the “big guys” will begin to take profit. I expect between 300-500 pips pull back before the bullish run could continue. A total 1000 pips reversal to 1.5300 is also a possibility. The barriers to the reversal are as follows:

1.6050
1.5800
1.5650
1.5300

Based on the above analysis, my sell at 1.6250 is valid until the weekly candle successfully breaks through 1.6300 Masterchart barrier or good for about 250 pips until the daily RSI fails to break the 50 points mark. Furthermore, 1.6000 – 1.6300 is made of ‘bunker’ very tough level to break.

I will monitor the next 3-4 daily candles for indication whether we will break through 1.6300 and post my views on a weekly basis until 1.6300 is successful broken/or acted as resistance.

Whatever you do, don’t buy until 1.6300 is successfully broken by the weekly candle and the price is above 1.6400. The MPAA shows that the bullish run might still continue until the middle of the year, while the second part of the year might be used for taking profits and winding down.

See the Monthly, Weekly, Daily, H4 charts in support of the above analysis.


Attached Thumbnailshttp://www.forexfactory.com/attachme...1&d=1335800889 http://www.forexfactory.com/attachme...1&d=1335800889 http://www.forexfactory.com/attachme...1&d=1335800927 http://www.forexfactory.com/attachme...1&d=1335800927
  • Post #12
  • Quote
  • May 15, 2012 5:23am May 15, 2012 5:23am
  •  Articulate
  • Joined Jun 2009 | Status: Member | 822 Posts
THE BEST TIME TO GO LONG (BUY) OR SHORT (SELL) FOR GBPUSD

What I will discuss today is the yearly trading cycle that is best suited for retail traders. Put differently, the safest months of the year to long or short. I have earlier discussed the period for a different purpose. If you want to know the best time to go long/short you will find the answer in the Monthly Price Action Analysis (MPAA). As a reminder, price moves for the first 6 months (Jan-June) in one direction (bull/bear), consolidates for the next 3 months (July-Sept), and closes for the last 3 months (Oct-Dec). For GBPUSD and most major pairs, prices reach their peaks (high/lows) twice in year i.e. May/June and Nov/Dec.

The best times for any retail trader to go long/short as long as the Cable is concern is therefore in the months May/June & Nov/Dec of every year. Nov/Dec are however not reliable because it is the end of the year. The big players after booking their profits, usually start on a clean slate and it could be bull/bear. November/December could go either way. On the other hand, May/June is the best period to take a decision on wheether to go long or short for the following reasons:

a) The ‘big players’ would have pushed the price in the desired direction for about 5 months
b) By this period, price would have moved by at least a thousand pips and more
c) After this period price generally don’t move far higher or lower, unless something dramatic happens
d) The highest/lowest prices for the year are usually recorded around this period
e) Most big players begin to book their profits and reverse their positions around this period of the year.

If you want to increase your chance of your success as a retail trader, roll your trading calendar from May to April of the following year, but always remember to book your profit between October-December.

I attached a monthly and a weekly charts for about 20 years period to clearly illustrate this above analysis.

The direction of the market are always planned ahead, follow the 'big players' and you will never be a victim of the ruthlessness of the market. This is the bigger picture!
Attached Thumbnailshttp://www.forexfactory.com/attachme...1&d=1335808787 http://www.forexfactory.com/attachme...1&d=1335808787 http://www.forexfactory.com/attachme...1&d=1335808813
  • Post #13
  • Quote
  • Edited at 7:15am May 15, 2012 5:45am | Edited at 7:15am
  •  Articulate
  • Joined Jun 2009 | Status: Member | 822 Posts
Masterchart levels are like magnets to price actions. The weekly candles either sit on them or give them "lovely kisses". Look at the masterchart levels at 1.5300 and 1.6300 (see the right signs on the two weekly that sat on and kissed the masterchart level) . We have seen the first kiss of 1.6300, will there be second kiss? Let wait and see!

Trading is strategic. Alway have a strategy and wait for the right moment.


Attached Thumbnailshttp://www.forexfactory.com/attachme...1&d=1336041375
  • Post #14
  • Quote
  • May 15, 2012 6:42am May 15, 2012 6:42am
  •  ramonramirez
  • | Additional Username | Joined Apr 2012 | 16 Posts
Great discussion articulate, great thanks!!
  • Post #15
  • Quote
  • May 17, 2012 5:46am May 17, 2012 5:46am
  •  Articulate
  • Joined Jun 2009 | Status: Member | 822 Posts
Quoting Articulate
Disliked
Masterchart levels are like magnets to price actions. The weekly candles either sit on them or give them "lovely kisses". Look at the masterchart levels at 1.5300 and 1.6300 (see the right signs on the two weekly that sat on and kissed the masterchart level) . We have seen the first kiss of 1.6300, will there be second kiss? Let wait and see!


Attached Thumbnails
Ignored
I am forced to post again this week because of the interesting developments in the last few days. The weekly candle smashed through 1.6000, 1.5900 and almost touched 1.5850 (almost 450 pips retrace so far). The Daily RSI also smashed the 50 point mark.

The Greece crisis is clearly giving the bear an unbelievable energy. Bears are in control everywhere. Where will this week's candle close? The last two days of this week will be very interesting. . I am still looking at 1.5800-1.5850. If this level is broken, who says we cannot go 1.5500 or 1.5300 for a complete reversal of the 1000 pips move? If there is something to share, I will still post before the end of the week.

See the weekly and daily charts as at the time of writing.

It is always helpful to have a strategic plan in place! Enjoy the rest of the week.
Attached Thumbnailshttp://www.forexfactory.com/attachme...1&d=1337247190 http://www.forexfactory.com/attachme...1&d=1337247190
  • Post #16
  • Quote
  • May 24, 2012 4:12am May 24, 2012 4:12am
  •  Articulate
  • Joined Jun 2009 | Status: Member | 822 Posts
It took 14 candles about four months to complete a 1000 pips journey, but three weeks to complete a 500 pips reversal. Last week’s candle alone yielded over 400 pips. What happens clearly point out the important of patience and timing in forex trading. The monthly candle has reversed the gains for last month and is threatening to wipe out the gains fro the last two month. Will it reverse the gain the first four months of the year or end up a billish candle with a long pin? Anything is possibe in forex, but if you follow the market one weekly candle at a time, one resistance/support level at time, you will always be on the profitable path. Now back our discussion for this weeek.

Let me quote part of the post above to remind us of where I stand on the cable. Last week's candle closed at 1.5808, right on top of a support. You know I said after 50% retrace price could go either way. What do you do in such scenario? A full week's candle will tell you where price will go. It will close above 1.5800 to confirm reversal or below 1.5800 to indicate continuation of the bearish run. Then go back to your chart and identify the nearest support and resistance to know where it is heading. In this case the nearest support and resistance are as follows:

1.6000 - the psychological support turned resistance
1.5600 - the nearest support

While waiting for this week's candle to close what do we do?

Firstly, after the close of trading every Monday, check the candle for the week and see how it looks. A pin above the weekly candle is an indication of a failed bullish attempt while a pin below indicates a failed bearish attempt. Most times price movements on Monday are usually false. Experienced day traders, ignores Mondays and trade only from Tuesdays-Thursdays.

Secondly, go to your Daily trade-friendly chart and see where the RSI is. Has it taken a dip into the yellow zone below 30 point mark. My daily trade-friendly chart tells me that the time is getting ripe to go long, but it can go as low as 20.56 point Will it get there? I don't know, but technical analysis tells me that 20.65 is the safest point in history to place a buy on the daily-friendly chart. In case, it doesn't get there, the failure of at least 3-4 daily candles to break a support while the RSI is in the yellow zone is a signal that it is safe to enter a trade.

If you are interested in a short term trades (50 pips or less) while waiting for the daily candles to give you signals whether to go long or short, go to your H4 50 PPAA chart and trade in the direction of the weekly from Tuesday until you receive signals first from the daily chart and finally the weekly chart.

What do I mean by trade in the direction of the weekly? If by Tuesday of any week, the week's candle is bearish, sell at every pull back if four H4 candles fail to break higher. Conversely if the week's candle is bullish, buy at every pull back if four H4 candles fail to break lower.

For H4 50 PPAA, you should aim at about 50 pips per trade. You should either set you TP at 50 pips or close these trades two H4 candles after your entry candle. For example if you enter the trade at the 8:00 a.m. candle, you either close it when you get 50 pips of close the trade at 8:00 p.m. candle. Remember, these short term trade while waiting for signals on the higher time frames.


I attach the weekly, monthly daily and H4 charts as usual for a better understanding of the above analysis.

Enjoy your week!
Attached Thumbnailshttp://www.forexfactory.com/attachme...1&d=1337804077 http://www.forexfactory.com/attachme...1&d=1337804077 http://www.forexfactory.com/attachme...1&d=1337804124 http://www.forexfactory.com/attachme...1&d=1337804124
  • Post #17
  • Quote
  • Jun 22, 2012 9:40am Jun 22, 2012 9:40am
  •  chinenye
  • | Joined Mar 2012 | Status: Junior Member | 2 Posts
I am enjoying your write ups. Please keep it going.Can I know your thoughts on EurUsd for the coming week.
Thanks.
  • Post #18
  • Quote
  • Jul 17, 2012 10:27am Jul 17, 2012 10:27am
  •  Articulate
  • Joined Jun 2009 | Status: Member | 822 Posts
We have just completed the first half of the year in June and the second commenced in July. Where are we going? Look at the monthly charts below for some major pairs. What did you see? How many of the pairs completed 1000+ pips movement and what was the reaction? Did you see the weekly lines on the monthly charts? Can see the direction? Where do you think we are we going in the next six months? Find answers to these questions and you will be a better trader.


Attached Thumbnailshttp://www.forexfactory.com/attachme...1&d=1341077747 http://www.forexfactory.com/attachme...1&d=1341077747 http://www.forexfactory.com/attachme...1&d=1341077794 http://www.forexfactory.com/attachme...1&d=1341077794
  • Post #19
  • Quote
  • Jul 17, 2012 10:39am Jul 17, 2012 10:39am
  •  Articulate
  • Joined Jun 2009 | Status: Member | 822 Posts
Here are more monthly charts for additional major pairs. Study these charts and the weekly charts until you begin to clearly understand where the big buys are going. If you don't know what to do here are some tips:

a) The direction of the weekly candle are always clear - in fact it is hidden secrets of most successful players.
b) Most currency pairs travel 1000 + pips before major reversal.
c) Most times after 500 pips movement, price usually stalls, but the weekly candle will tell you if the movement will continue
d) Look out for weekly pins for reliable signs of reversals especially after 500 pips and 1000 pips price movement


Attached Thumbnailshttp://www.forexfactory.com/attachme...1&d=1341079687 http://www.forexfactory.com/attachme...1&d=1341079687 http://www.forexfactory.com/attachme...1&d=1341079724 http://www.forexfactory.com/attachme...1&d=1341079724
  • Post #20
  • Quote
  • Jul 19, 2012 3:58am Jul 19, 2012 3:58am
  •  Articulate
  • Joined Jun 2009 | Status: Member | 822 Posts
You will have noticed some red and yellow triangles on the half-year charts. The triangles are lines in the sand. This is another tools that can greatly improve your success. The line in the sand is the point the big players are protecting. In simple term it is expected to serve as a temporary halt to either a bullish or bearish run. It usually take major trends to break this lines. A pin outside these lines are false breakouts.

How do you draw a line the sand?

Pick the last weekly candle of any pair after a run of at least (1000 pips for most pairs, 1300-1500 pips for GBPJPY and 750 pips for AUDUSD) and draw a triangle (red for bull and yellow for bear) on the pin of that last weekly candle. In a bearish run, 1 weekly candle need to open and close above that triangle to confirm a reversal. In a bullish run, 1 weekly candle needs to open and close below that triangle to confirm a reversal. If the line is crossed, wait for the end of the following week and draw another line, until a reversal is confirmed. That way you will avoid standing on the path of a moving train, identify the station and join the train early before it is too late. Always remember that the weekly candles never lies.! Study the charts I posted above more carefully for a better understanding of the simple technique.

Enjoy the rest of the week!
  • Trading Discussion
  • /
  • Articulate's MasterCharts Trading Style
  • Reply to Thread
    • Page 1 23456 9
    • Page 1 234 9
0 traders viewing now
  • More
Top of Page
  • Facebook
  • Twitter
About FF
  • Mission
  • Products
  • User Guide
  • Media Kit
  • Blog
  • Contact
FF Products
  • Forums
  • Trades
  • Calendar
  • News
  • Market
  • Brokers
  • Trade Explorer
FF Website
  • Homepage
  • Search
  • Members
  • Report a Bug
Follow FF
  • Facebook
  • Twitter

FF Sister Sites:

  • Metals Mine
  • Energy EXCH
  • Crypto Craft

Forex Factory® is a brand of Fair Economy, Inc.

Terms of Service / ©2021