|
Joined Apr 2011
|
Status: Basket Case
|274 Posts
Hi LG,
Thanks for sharing.
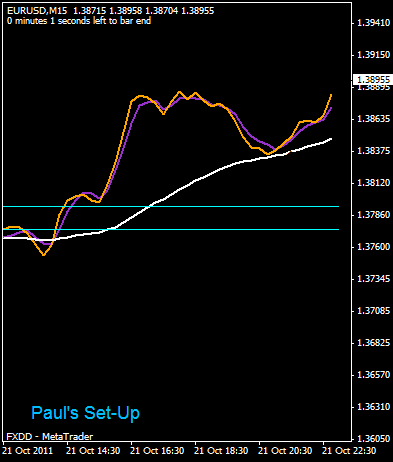
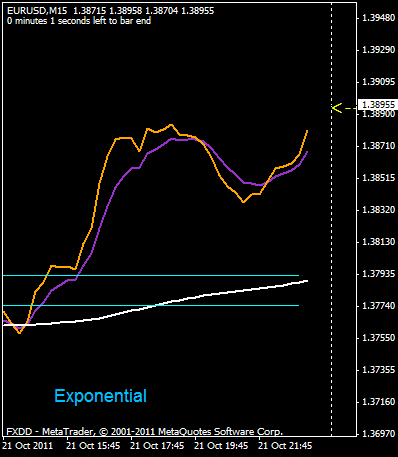
You asked in an earlier post about alternative settings. Compare the following with the 3/8/200 which you use. I was using this configuration for something else but it actually works very well when used in the same way as you use yours.
Gold, simple ma on close, period 2, shift 0
Purple, smoothed ma on median, period 2, shift 1
White, linear weighted ma on close, period 50, shift 0
I recall you use a trailing stop but the crosses on these work quite well for entries and exits. For example, see the nice move up on Friday end of session on AU H1.
A cross needs to be a definite cross (4 or 5 pip difference between the 2 shorter ma's) not just a touching of the two.
Looks OK on the M15 too but I've not tried the other TFs. The same rules can be applied as your original idea.
This is similar to what I use, though adding the 200ma for direction is a nice addition. I use a 3/7EMA cross over.
Since 2008 the Euro/USD is pretty highly correlated with the Dow Jones Industrial average. I use the same ma cross over there as well. As long as the Dow is long, based on the ma's I am long the Euro. When the Dow's ma's cross I am short. I use a very low margin and don't work with any stop losses. I just check it once or twice a Day. If it looks like there is a cross over on a particular day, I wait until the next day for confirmation. That's it. You could also use Bollinger Bands for trend direction.
Thanks for sharing. It is nice how many people are willing to share their methods on this forum.
You asked in an earlier post about alternative settings. Compare the following with the 3/8/200 which you use. I was using this configuration for something else but it actually works very well when used in the same way as you use yours.
Gold, simple ma on close, period 2, shift 0
Purple, smoothed ma on median, period 2, shift 1
White, linear weighted ma on close, period 50, shift 0
I recall you use a trailing stop but the crosses on these work quite well for entries and exits. For example, see the nice move up...
Ignored
Thanks, Paul. I'm going to set up that template right now and take a look. You use the 50 for direction?
This is similar to what I use, though adding the 200ma for direction is a nice addition. I use a 3/7EMA cross over.
Since 2008 the Euro/USD is pretty highly correlated with the Dow Jones Industrial average. I use the same ma cross over there as well. As long as the Dow is long, based on the ma's I am long the Euro. When the Dow's ma's cross I am short. I use a very low margin and don't work with any stop losses. I just check it once or twice a Day. If it looks like there is a cross over on a particular day, I wait until the next day for confirmation....
Ignored
I like to pay attention the the dollar index, but have not paid attention to the Dow direction as it seems more erratic. I will start doing that...thanks for suggesting that.
I used to follow the dollar index fairly closely. After a while I begin to see a stronger correlation between the Dow and the euro/$. No relation is perfect or forever. The key is adaptability and flexibility. There does seem to be a strong correlation in all asset classes, except gold. Thus when the Dow is up crude oil is usually up, grains are usually up, and so is the Euro/$. Oh yes, the dollar index is down. Normally, it shouldn't work this way, but we are not in normal times.
I used to follow the dollar index fairly closely. After a while I begin to see a stronger correlation between the Dow and the euro/$. No relation is perfect or forever. The key is adaptability and flexibility. There does seem to be a strong correlation in all asset classes, except gold. Thus when the Dow is up crude oil is usually up, grains are usually up, and so is the Euro/$. Oh yes, the dollar index is down. Normally, it shouldn't work this way, but we are not in normal times.
Ignored
I'll start keeping an eye on the Dow too. Thanks for this concise summary of the correlations.
HI All,
LG nice thread. thanks for the time,effort and sharing. Crossovers with least twist and baggage.
Puritan, Jolly,will check Dow out, I use the e-mini futures effectively for the same. The dollar index (inverse) lags a tad bit.
When this recent "crisis" began, all correlations fell apart. All went up and down together. When afraid, the markets move in unison. Changing relationships interpretation is prabably another art.
Like the positive energyhttp://www.forexfactory.com/images/icons/icon7.gif
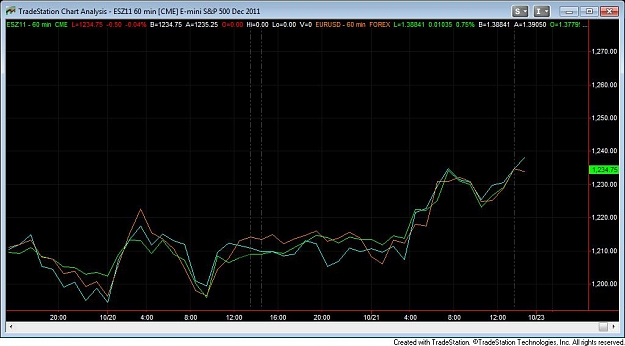
Emini (ESZ11)-EU-AU 60min chart
Fullpip
I'll start keeping an eye on the Dow too. Thanks for this concise summary of the correlations.
Ignored
I also discovered when shares of a particular country is up de currency is down and vice versa. E.g. when european stocks are up Euro is usually down and when down Euro is up same with US stocks and currency
We trade to live not live to trade................
I've been thinking about this strategy over the weekend, in particular how it interacts with the 4 candle H1 BO strategy.
There are two things that bother me, the risk of picking up a false BO and the fact that we are jumping on the bandwagon AFTER the BO.
Every man and his dog can watch the period of consolidation, followed by a powerful PA movement outside of the trading range. Everyone will be getting in when price moves outside the range (which is surely one of the reasons for false BOs?).
So, I've had an idea, which of course might be completely useless (I'm pretty amateur!), so feel free to explain to me where I'm going wrong if I've missed the boat completely!
OK. So at the moment, we are looking for a period of consolidation/range bound price. Then we look for a BO of that range (which is confirmed by the lovely north/south angles on the 3 EMA and generally a cross of the 3/8EMAs.
Let's say the 200EMA is up (so we have identified an uptrend), and the price is bouncing around in a range of around 35 pips in the hours leading up the London open.
Instead of buying AFTER the price has moved outside of the range, why not buy at the BOTTOM of the trading range? The logic in my head is as follows:
1. Presuming we have identified an established channel (i.e. 2 or 3 tests of the S/R) it is probable that the bottom of the range will act as support and the price will bounce off it, therefore our SL can be pretty tight (we are watching it bounce off support, there is no need to let the trade "breathe", if it's going south then we were completely wrong and best to cut it asap with as little loss as possible).
2. We can place 2 separate trades (e.g. instead of placing one trade outside of the box for 0.1 lots, we place two trades at the bottom of the range for 0.05 lots). If the price bounces off the support, it is probable that it will head up to the resistance at the other end of the range (we are expecting a BO after all!), if it does that then we are immediately in profit. We close one trade once the resistance is reached and adjust the SL on the remaining trade to secure a small profit.
Now, the price will either breakout and run as we expected, bounce back off the resistance or, perhaps most importantly, break out but then retrace fairly quickly.
a) If the price breaks out and runs, then we are miles ahead most other traders who will be getting in once the resistance has been broken. Their initial buying frenzy will push the price up nicely to secure a decent amount of pips for our remaining trade. We will have got in there early.
b) If the price bounces off resistance the worst it can do is trigger our adjusted SL, which will at worst leave us in a no loss position. At best it may continue north after a minor correction, without triggering our SL.
c) If we get caught out with a false BO (which is the biggest killer with these sorts of strategies) we will be in the same position as above, we won't have lost anything thanks to the profit on our initial trade.
This seems to fit better with the sell highs and buy lows principle (e.g. why buy the high of the breakout?).
Clearly, it will be important to drop down to a lower TF to confirm the rebound off support (e.g. checking for momentum on the M15 for trading the H1), and surely our EMAs could come in handy here? Confirming that the price is starting to turn in our intended direction?
Apologies if this is way off the mark, but I'm trying to think outside of the box here (excuse the pun!) and milk as many pips from BO's as possible, whilst minimising the risk posed by false BOs.
Comments or suggestions from more knowledgable traders would be most welcome!
I've been thinking about this strategy over the weekend, in particular how it interacts with the 4 candle H1 BO strategy.
There are two things that bother me, the risk of picking up a false BO and the fact that we are jumping on the bandwagon AFTER the BO.
Every man and his dog can watch the period of consolidation, followed by a powerful PA movement outside of the trading range. Everyone will be getting in when that prices moves outside the range (which is surely one of the reasons for false BOs?).
So, I've had an idea, which of course might...
Ignored
Some very good ideas here, FP. I especially like the two trades suggestion.
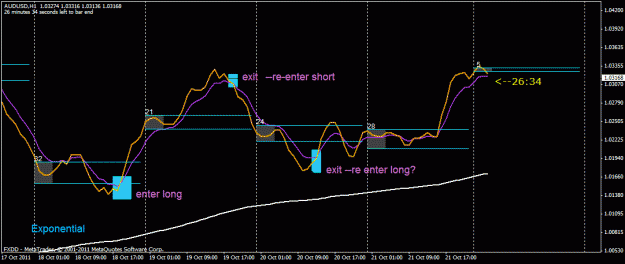
Keep in mind that I see this as a better cross over trend trading set up than a BO set up. I added the box lines to see if the two systems compliment each other and they do.
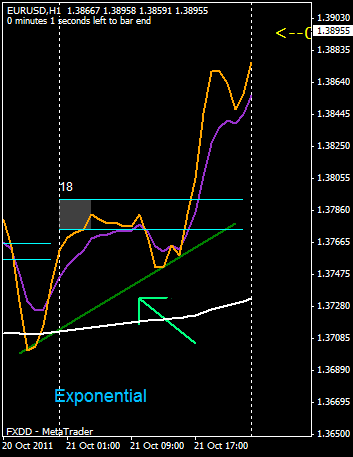
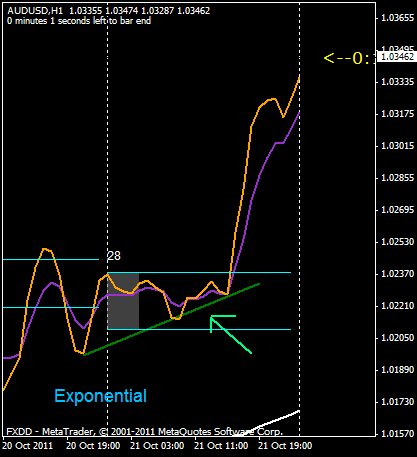
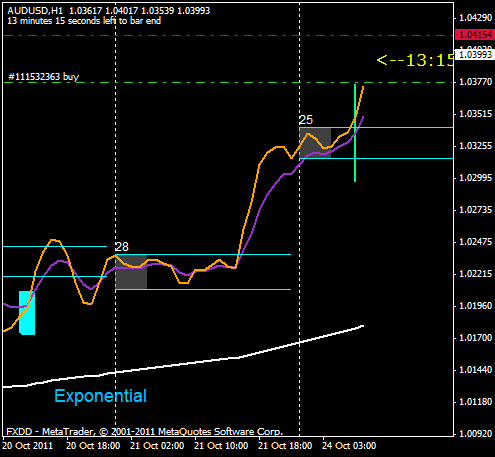
Looking at AUDUSD from last week, the cross on October 18 was a beautiful trend cross trade that turned into a H1 4C BO on the 18th and continued as a trend/BO trade on the 19th. It was on the 20th that the conslidation began and the crosses had to be carefully watched to trade.
Buying at the bottom of the band would have gotten us in trouble. I bought at the bottom thinking there was going to be a trendline bounce--and there was---but I was too early and lost 40 somthing pips. Then on the 21st we had both a cross and a BO and it became a beautiful trade.
I like your ideas, but I think we have to look at the set ups not in isolation, but in relation to each other.
Some very good ideas here, FP. I especially like the two trades suggestion.
Keep in mind that I see this as a better cross over trend trading set up than a BO set up. I added the box lines to see if the two systems compliment each other and they do.
Looking at AUDUSD from last week, the cross on October 18 was a beautiful trend cross trade that turned into a H1 4C BO on the 18th and continued as a trend/BO trade on the 19th. It was on the 20th that the conslidation began and the crosses had to be carefully watched to trade.
Nice thread lawgirl. Thanks.
What your chart shows is that the crossovers when trending are great.
When consolidating the BO lines can keep us from getting whipsawed.