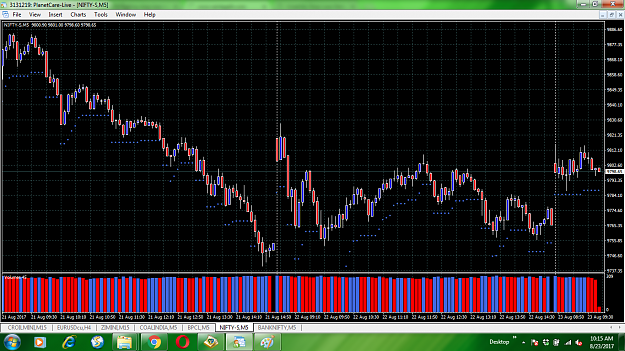
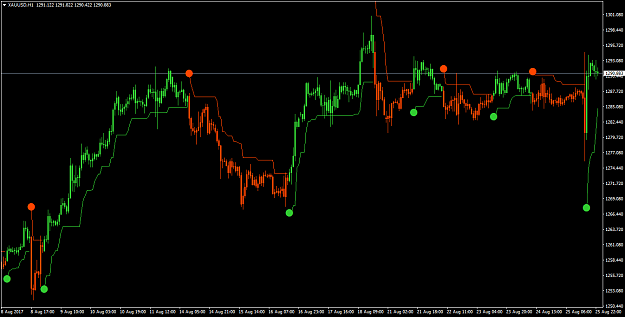
Just wondering if anyone knows of an indicator similar to the one posted below?
This one paints a trailing stop loss above or below price based on the Average True Range. I think this particular indicator was intended for a stop and reverse type strategy. However, the problem with this one is once a candle first breaks the trailing stop line, the new line on the opposite side of price does not appear until 1 candle later. Therefore if you were using a stop and reverse strategy, you wouldn't know where your initial stop loss should be until one candle later, which pretty much renders this indicator useless.
I've searched for other indicators like this and have found 7 by different names, and they all have the same problem. So does anyone know of an indicator which works the same as this one, but paints a new trailing stop line on the opposite side of price "immediately" the previous line is broken, on the same basis that the PSAR indicator immediately paints a new dot?
Any help is as always greatly appreciated.
Attached File(s)

