• Home
  • Forums
  • Trades
  • News
  • Calendar
  • Market
  • Brokers
  • Login
  • Join
  • User/Email: Password:
  • 5:29pm
Menu
  • Forums
  • Trades
  • News
  • Calendar
  • Market
  • Brokers
  • Login
  • Join
  • 5:29pm
Sister Sites
  • Metals Mine
  • Energy EXCH
  • Crypto Craft

Options

Bookmark Thread

First Page First Unread Last Page Last Post

Print Thread

Similar Threads

M candles / Custom candles for second charts 1 reply

Calculating only buy candles vs sell candles 2 replies

Platform which enables the rewinding of candles 3 replies

Missing candles? 1 reply

I need more candles! 4 replies

  • Commercial Content
  • /
  • Reply to Thread
  • Subscribe
  • 2,054
Attachments: Beyond the Candles
Exit Attachments
Tags: Beyond the Candles
Cancel

Beyond the Candles

  • Last Post
  •  
  • 1 121122123Page 124125 126
  • 1 Page 124 126
  •  
  • Post #2,461
  • Quote
  • Mar 8, 2021 1:51pm Mar 8, 2021 1:51pm
  •  fxgroup
  • | Commercial Member | Joined Nov 2010 | 1,178 Posts
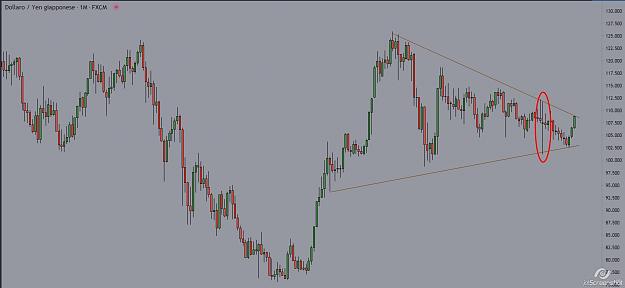
USDJPY


The controlling bar still in charge !

Attached Image (click to enlarge)
Click to Enlarge

Name: USDJPY.jpg
Size: 82 KB
Nothing personal,just business
 
 
  • Post #2,462
  • Quote
  • Mar 25, 2021 5:02pm Mar 25, 2021 5:02pm
  •  fxgroup
  • | Commercial Member | Joined Nov 2010 | 1,178 Posts
Quoting dra794
Disliked
Ehy fxgroup, you're right. I was just going to write an update here and i found your comment! I evaluated to close my USDPLN trade, even if it was losing. Considering the trade i just did on GBPNOK , i made a slight profit overall. So overall i'm satisfied, but i'm really "angry", or to better say, "frustrated" for the USDPLN trade. Here is a new graph of the same pair.. There's a strong zone ABOVE the daily Rm you were talking about. The easiest plan i could follow was to wait for the price to break above, retest and wait for a D PA on the level,...
Ignored
Your trade just reached the TG !
Nothing personal,just business
 
 
  • Post #2,463
  • Quote
  • Mar 27, 2021 7:53pm Mar 27, 2021 7:53pm
  •  dra794
  • | Joined Jul 2017 | Status: Member | 36 Posts
Quoting fxgroup
Disliked
{quote} Your trade just reached the TG !
Ignored

Dearest Ian,
unfortunately not: i did close my trade with a slight loss. My SL was placed under the BUOB when i posted the trade. I felt i had to close the trade because i didn't like how the price moved after that buob. Some days after that, the price reached the price where the stop loss were positioned.. So i was right to close the trade. But in the long run, the direction was right!
 
 
  • Post #2,464
  • Quote
  • Apr 9, 2021 7:54pm Apr 9, 2021 7:54pm
  •  dra794
  • | Joined Jul 2017 | Status: Member | 36 Posts
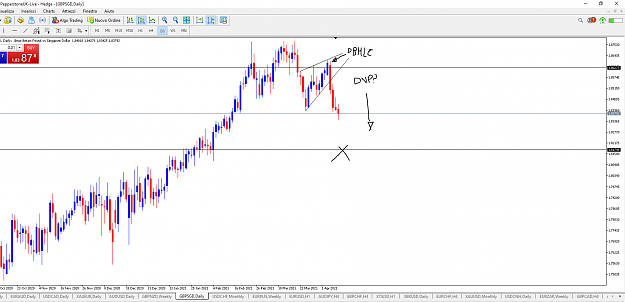
Trading idea: price hits R at 1.86273. After that, we've had a doji.. But, to me, the market has decided with that dynamic RM, and the DBHLC.
Where does the price go? 1.81798.


Attached Image (click to enlarge)
Click to Enlarge

Name: idea1.png
Size: 31 KB
Attached Image (click to enlarge)
Click to Enlarge

Name: idea.PNG
Size: 71 KB
 
 
  • Post #2,465
  • Quote
  • Apr 16, 2021 4:41pm Apr 16, 2021 4:41pm
  •  dra794
  • | Joined Jul 2017 | Status: Member | 36 Posts
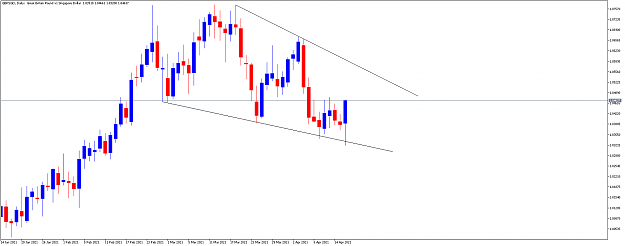
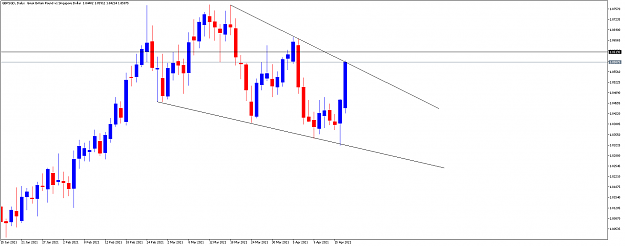
UPDATE GBPSGD: Still observing this pair without any trade being done for now. However, the market has given us further informations. At the moment, in my humble opinion, a trader should be REALLY careful if he/she's evaluating a short trade. I'm glad i didn't open that short trade at last. There's a strong support where the price reacted strongly bullish after a lot of liquidity has been spent with the previous bearish swing without any major correction. Probably it's wiser to wait and wait for a clear decision of the market. For now, i'm expecting a bullish correction..

Attached Image (click to enlarge)
Click to Enlarge

Name: GBPSGDDaily.png
Size: 38 KB
 
 
  • Post #2,466
  • Quote
  • Apr 17, 2021 3:55am Apr 17, 2021 3:55am
  •  fxgroup
  • | Commercial Member | Joined Nov 2010 | 1,178 Posts
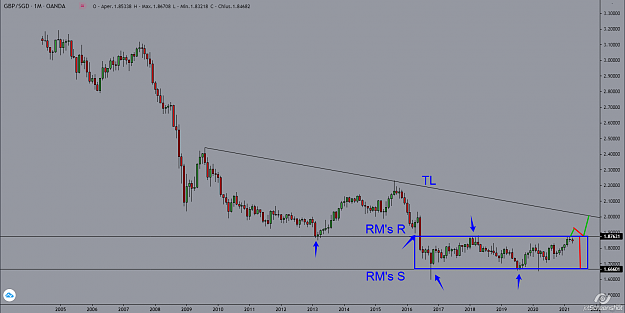
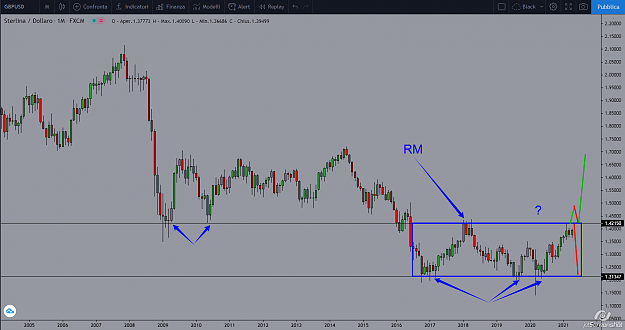
This is my PTT&TTP on GBPUSD

The P reached the RM's R and we have to wait for an information if the sellers will push the P down back to the RM's S or if the buyers will go beyond the R..wait...wait..wait

Attached Image (click to enlarge)
Click to Enlarge

Name: _GBPSGD .png
Size: 51 KB
Nothing personal,just business
 
 
  • Post #2,467
  • Quote
  • Apr 18, 2021 6:48pm Apr 18, 2021 6:48pm
  •  dra794
  • | Joined Jul 2017 | Status: Member | 36 Posts
I think you're right. I thought we had the opportunity for a short trade but it seems like now the GBP is gonna rally bullish.. Luckily i didn't get in, i didn't trust totally that trade.
Better to wait.
 
 
  • Post #2,468
  • Quote
  • Apr 19, 2021 9:58am Apr 19, 2021 9:58am
  •  dra794
  • | Joined Jul 2017 | Status: Member | 36 Posts
UPDATE: Seems like the bullish correction happened really fast at last!!! Thankful i didn't short ..

Attached Image (click to enlarge)
Click to Enlarge

Name: GBPSGDDaily.png
Size: 39 KB
 
 
  • Post #2,469
  • Quote
  • Apr 19, 2021 3:00pm Apr 19, 2021 3:00pm
  •  fxgroup
  • | Commercial Member | Joined Nov 2010 | 1,178 Posts
Sorry..I wrote GBPUSD...I was meaning GBPSGD !
Nothing personal,just business
 
 
  • Post #2,470
  • Quote
  • Apr 22, 2021 12:58pm Apr 22, 2021 12:58pm
  •  peppe.999
  • | Joined Apr 2021 | Status: Junior Member | 1 Post
greetings to everyone, mainly to fxgroup, I'm happy with your return.
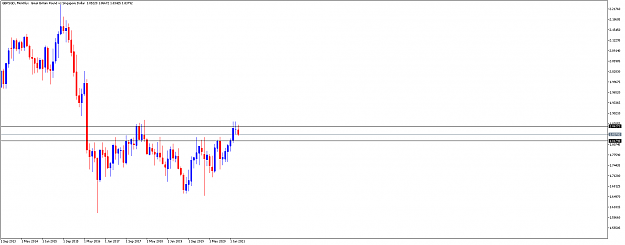
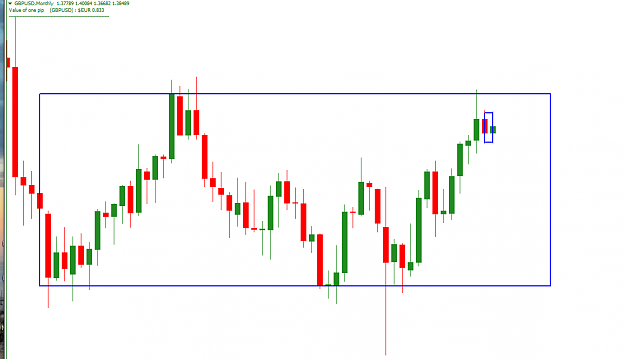
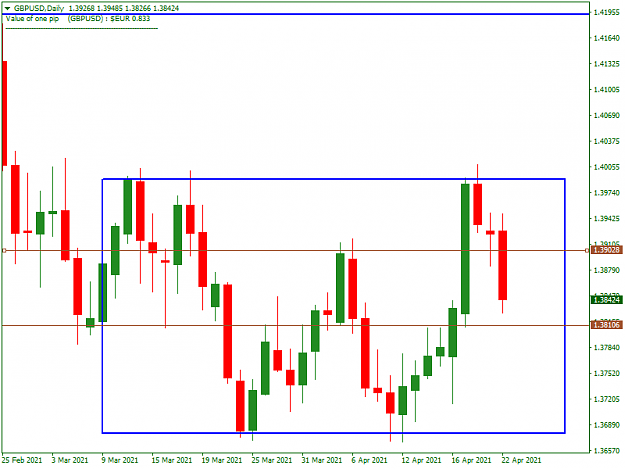
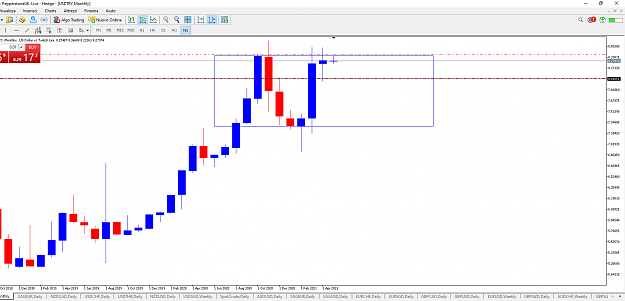
I tried on the Italian forum, but nothing. returning to us gbpusd I see it like this.
Attached Image(s) (click to enlarge)
Click to Enlarge

Name: GBPUSDMonthly.png
Size: 21 KB
Click to Enlarge

Name: GBPUSDDaily.png
Size: 28 KB
 
 
  • Post #2,471
  • Quote
  • Apr 23, 2021 9:04am Apr 23, 2021 9:04am
  •  dra794
  • | Joined Jul 2017 | Status: Member | 36 Posts
Nice analysis, Peppe! Unfortunately, the italian forum has been close due to the lack of active members. Me and other 2 users were the only one posting there, so it was not worth keeping it online.
Back to GBPUSD, your analysis is great! But i would prefer to wait for the close of the monthly candle in order to wait for a retracement on the resistance level of the range market.
 
 
  • Post #2,472
  • Quote
  • Apr 23, 2021 11:02am Apr 23, 2021 11:02am
  •  peppe.9999
  • | Joined Jul 2013 | Status: Member | 39 Posts
tank you dra.
I found the old user.
I notice a dull situation here too, or am I wrong?
 
 
  • Post #2,473
  • Quote
  • Apr 23, 2021 9:06pm Apr 23, 2021 9:06pm
  •  dra794
  • | Joined Jul 2017 | Status: Member | 36 Posts
You're not wrong. This methodology requires years of practice, especially the "psychological component" of it. I guess not many traders are willing to work for years on their personality and create a mindset based on waiting, having patience and wait for the right moment to get in the market. I also lack of this patience, but i'm still trying.
 
 
  • Post #2,474
  • Quote
  • Apr 27, 2021 2:25am Apr 27, 2021 2:25am
  •  fxgroup
  • | Commercial Member | Joined Nov 2010 | 1,178 Posts
Quoting peppe.999
Disliked
greetings to everyone, mainly to fxgroup, I'm happy with your return. I tried on the Italian forum, but nothing. returning to us gbpusd I see it like this. {image} {image}
Ignored
Hi Peppe...nice to see you again !

GBPUSD...the M is telling all the sory we really need !
Nothing personal,just business
 
 
  • Post #2,475
  • Quote
  • Apr 27, 2021 7:17am Apr 27, 2021 7:17am
  •  peppe.9999
  • | Joined Jul 2013 | Status: Member | 39 Posts
that the price will come first up to the LM, M .
True? :-)
 
 
  • Post #2,476
  • Quote
  • Apr 29, 2021 2:10am Apr 29, 2021 2:10am
  •  novice198
  • | Joined Dec 2009 | Status: Member | 295 Posts
Quoting fxgroup
Disliked
{quote} Hi Peppe...nice to see you again ! GBPUSD...the M is telling all the sory we really need !
Ignored
Can you kindly explain more clearly with the chart.
Thanks
Novice
 
 
  • Post #2,477
  • Quote
  • Apr 29, 2021 4:05pm Apr 29, 2021 4:05pm
  •  fxgroup
  • | Commercial Member | Joined Nov 2010 | 1,178 Posts
Hi novice

The M chart shows us that the P is in RM and now the buyers reached the RM's R. We do not know yet if the buyers will push the P higher and will close above the RM's R or if the sellers will take the P controll. All we have to do is to wait for the P to make the first step in order to have the information.

Attached Image (click to enlarge)
Click to Enlarge

Name: GBPUSD.png
Size: 62 KB
Nothing personal,just business
 
 
  • Post #2,478
  • Quote
  • May 2, 2021 7:09am May 2, 2021 7:09am
  •  novice198
  • | Joined Dec 2009 | Status: Member | 295 Posts
Quoting fxgroup
Disliked
Hi novice The M chart shows us that the P is in RM and now the buyers reached the RM's R. We do not know yet if the buyers will push the P higher and will close above the RM's R or if the sellers will take the P controll. All we have to do is to wait for the P to make the first step in order to have the information. {image}
Ignored
Hi Fxgroup,
Thanks for the explanation. As I would be planing to Trade on a Daily Chart, Therefore, should we be looking at the Monthly Highest close area, Or monthly Highest point, or Daily Highest close area for clues to Go Short. Should we be looking for double top in this area for going short. Needless to state if the Price blows through the are Resistance, then we should be looking for the Price to come back and retest the Resistance ( which will become support) for going long.

Sometime back you had floated the idea of having some webinars, therefore, will you hold the webinar in near future. Maybe one to explain your strategy as well as to go over your last few trades to know the setup and reasons why you took the trade.

Thanks
Novice
 
 
  • Post #2,479
  • Quote
  • May 6, 2021 7:14am May 6, 2021 7:14am
  •  dra794
  • | Joined Jul 2017 | Status: Member | 36 Posts
USDTRY:
Attached Image (click to enlarge)
Click to Enlarge

Name: usdtry.PNG
Size: 54 KB
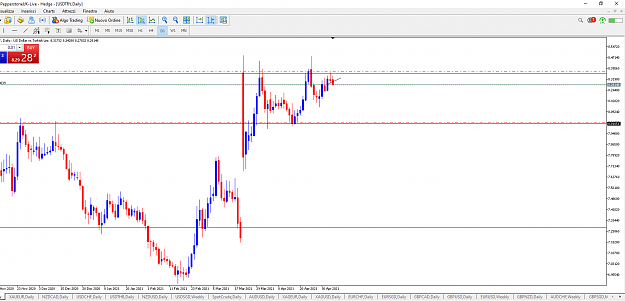
M: On the M chart we have a NCA information + doji. Momentum slows down. Moreover, the candle before the doji seems an exhaustion candle to me, since it occupies all the space from S to R without closing above.


Attached Image (click to enlarge)
Click to Enlarge

Name: usdtrydaily.PNG
Size: 63 KB


D: On the D chart we can see 2 pinbars: the first one is still "valid", and the second one yesterday on the lower timeframes is a H&S. I've opened a short trade at 8.28039 with SL at 8.37470 and TP at 8.01913.

Let's see how it goes, i'll update.
 
 
  • Post #2,480
  • Quote
  • Edited 3:27pm May 10, 2021 3:15pm | Edited 3:27pm
  •  dra794
  • | Joined Jul 2017 | Status: Member | 36 Posts
Quoting dra794
Disliked
USDTRY: {image}M: On the M chart we have a NCA information + doji. Momentum slows down. Moreover, the candle before the doji seems an exhaustion candle to me, since it occupies all the space from S to R without closing above. {image} D: On the D chart we can see 2 pinbars: the first one is still "valid", and the second one yesterday on the lower timeframes is a H&S. I've opened a short trade at 8.28039 with SL at 8.37470 and TP at 8.01913. Let's see how it goes, i'll update.
Ignored

UPDATE: I didnt' like how the price moved today.. So i decided to close my position with a tiny profit.
 
 
  • Commercial Content
  • /
  • Beyond the Candles
  • Reply to Thread
    • 1 121122123Page 124125 126
    • 1 Page 124 126
0 traders viewing now
  • More
Top of Page
  • Facebook
  • Twitter
About FF
  • Mission
  • Products
  • User Guide
  • Media Kit
  • Blog
  • Contact
FF Products
  • Forums
  • Trades
  • Calendar
  • News
  • Market
  • Brokers
  • Trade Explorer
FF Website
  • Homepage
  • Search
  • Members
  • Report a Bug
Follow FF
  • Facebook
  • Twitter

FF Sister Sites:

  • Metals Mine
  • Energy EXCH
  • Crypto Craft

Forex Factory® is a brand of Fair Economy, Inc.

Terms of Service / ©2023