DislikedKenneth Lee,Alfonso and co .you guys are all legends. Thank you for the great explanation and materials provided. so far I will say I have 80% understanding,I think I can pick level well . BUT,BUT,BUT I have a problem, can anyone please explain how to find the trend for the day or the right direction to trade? Do I just need to draw the D1/WK S/D levels and then trade the level? Some one please help. Many ThanksIgnored
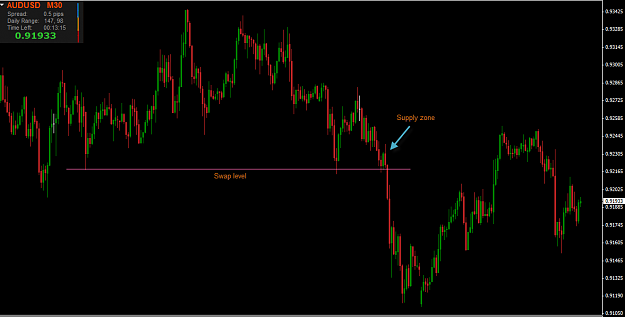
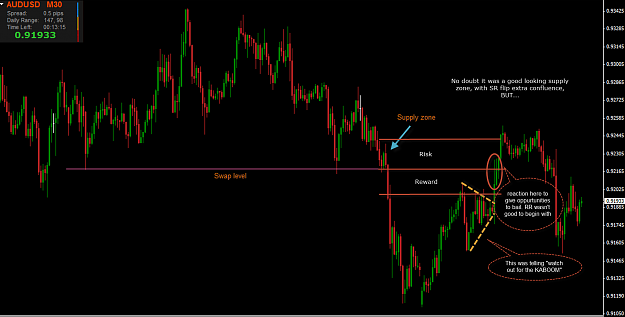
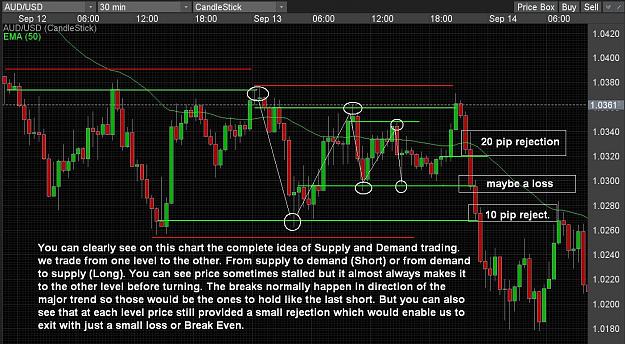
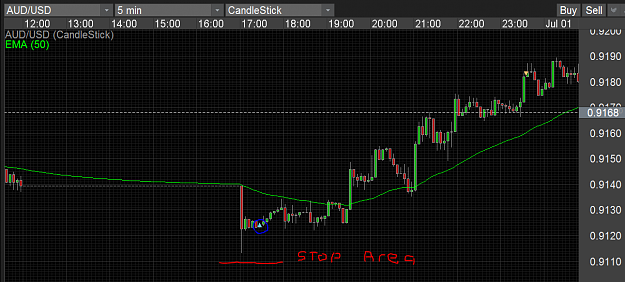
Let me take the above trade. I would say OZ is in a overall downtrend. Look at any longer term chart. If it wasn't I would have held for a bigger gain. The charts constantly make swings up and down. With screen time you can learn to see when they MOST likely will happen and to where. I did not just jump on this long because of the demand level .
1. I was waiting for the spread to get reasonable .
2. I was watching Price Action. The price did not go lower for about 20 minutes once it hit that spot and just went sideways. A lot of times on Sunday
evening open the initial move is just a completion of the Friday close movement .
3. We had other security. A big number always acts as a turning point and if it is with your trade a bit of a security wall, price will have to break so we had
.9100 right below. Talking of
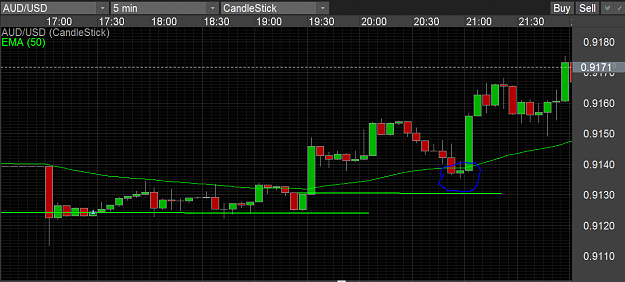
Talking about point 3 see where price turned back down .9200 Price is not a precise thing and as it takes a bit of time for orders to get filled price will find itself in and around a turning point , so a few beyond or short of your areas of interest is alright.
I am going to post a 5 min chart I personally never look at this time frame but it is the only way i can show the price action I was watching at the time I took the trade.
Boy the snip tool stinks but it is quicker than posting in and out of paint.
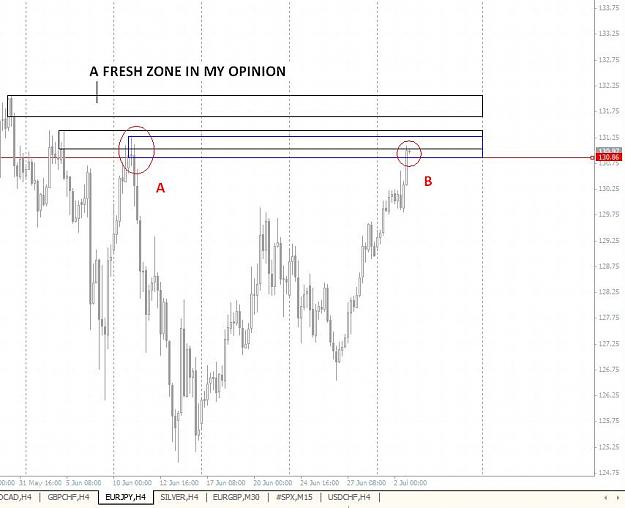
But for your main question I use the swing highs and lows for my trend. Lower highs mean down and Higher Lows mean up. Buy a low sell a high . Very simple really. In all of Sam's videos . He talks of picking levels off longer time frame charts then looking for entries of a faster chart. what he is looking for on the faster chart is the first change in swing direction.
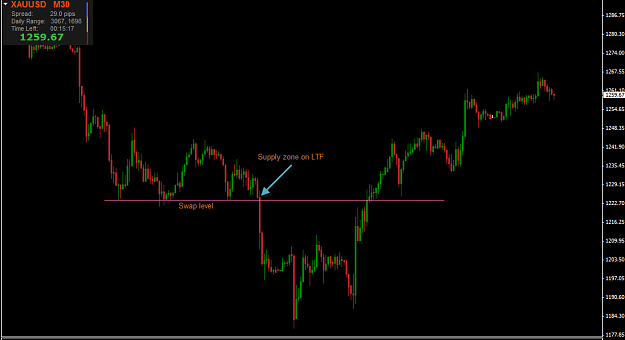
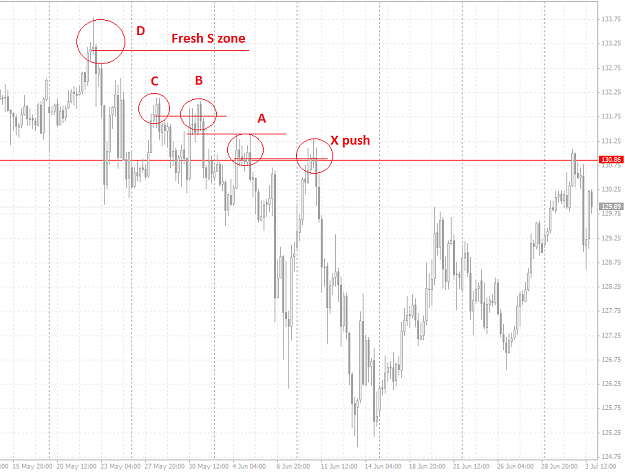
Say price is going down , we have a demand level spotted on the 4 hr chart. So we watch a 30 min chart for the first higher low for a entry and this higher low should be at a new demand level. Not meaning fresh , but newly formed.
I really hate posting fast charts as it isn't the way I trade. But again we Know the level on the 30 min. oz trade. a entry could have been taken on the 5 min after the first new swing. But it isn't the best but it does show the point. I call this the flip entry as it is when price flips over at or within the longer charts demand or supply level.
sure this is all clear as mud...... Cheers ken
Attached Image(s) (click to enlarge)
Good Trading To All ; Ken Lee