Few notes: - You may need to look further in time. From the chart that you show, market seem to be stalled in a ranging area - Not every trade will be profitable. This concept of trading on the supply / demand zone is to increase the odd. But this not a 100% winning concept - in your charts, price did react to demand / supply zone, but it is up to us to understand the further direction and witch one is a valid one. Very easy to understand with insigth charts but not se easy in real time. Honestly, I struggle a lot on that to System do work....
Ignored
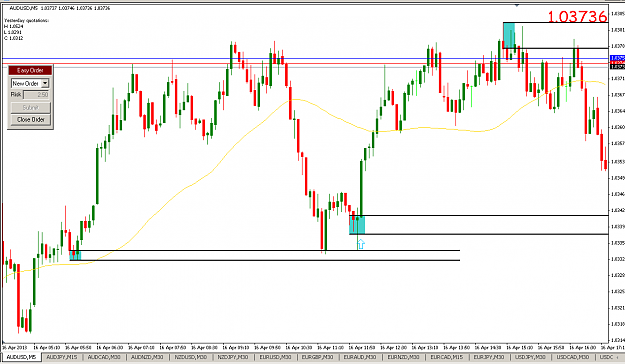
Awesome work on getting to where you are arjfca! Would you or anyone else consider this level (blue arrow) to be a fresh supply level on AUDUSD? I didnt take it because of the wick down to previous demand, I mean it was a great move away from that level, am I missing something? Thanks
For Example TraderinSD, You wouldn't pull any short trades until it hits the upper box named "Supply" 1.3096 area with a stop 1.3106 which is just about the supply box.
Ignored
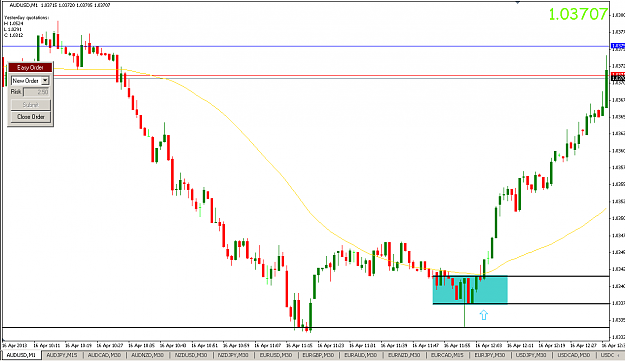
Yes, "as an example only".. This is what short looks like.. See the pattern...Stops and entries are determine base on size of account and risk tolerance.
Yes, "as an example only".. This is what short looks like.. See the pattern...Stops and entries are determine base on size of account and risk tolerance. I would try to place my stops outside the box.. TSD
Ignored
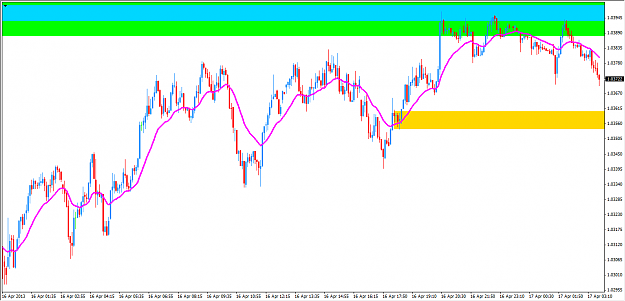
Perfect, As you can see the EUR/USD now it seems like it will be making fresh supply soon...so i'll be looking for a Drop..then a run back to the base (supply) to execute a trade if im not mistaken.
Edit : Sorry. I'll be looking for a DROP then a BASE then a RISE To execute a short at the fresh Supply that's being made right now...
Perfect, As you can see the EUR/USD now it seems like it will be making fresh supply soon...so i'll be looking for a Drop..then a run back to the base (supply) to execute a trade if im not mistaken. Edit : Sorry. I'll be looking for a DROP then a BASE then a RISE To execute a short at the fresh Supply that's being made right now...
Ignored
Yeh if we get a strong drop from this level, then we would have created a Rally Base Drop, to short into on a retrace to the base.
Hey thestarting, I'm not saying I'm right and please any of the veterans please correct me, but this is where Id be looking for a trade on EURUSD. Aussie {image}
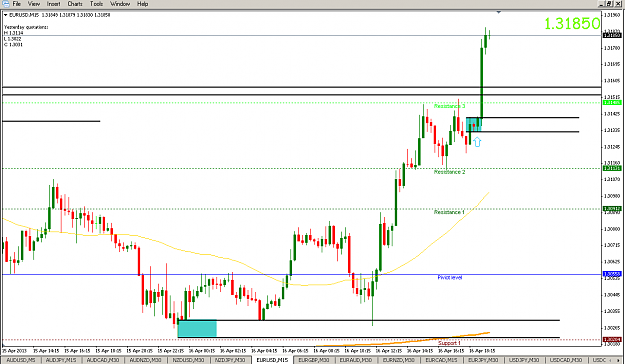
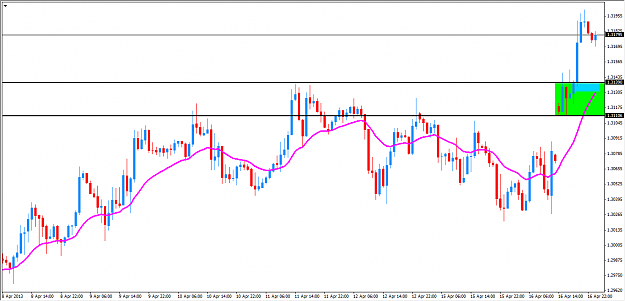
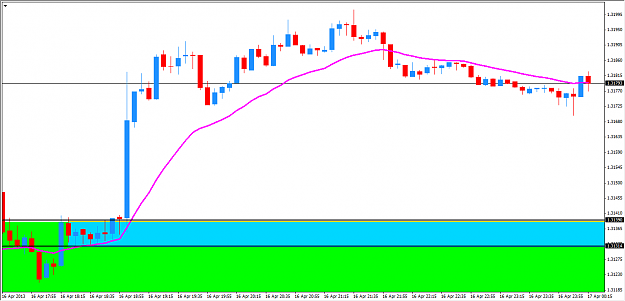
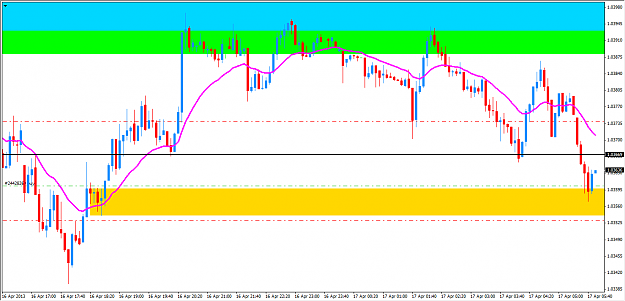
Today, the pair had a vigorous move through 1.3140/60 supply, causing the clearance of all the unfilled sell orders and producing in the process a fresh demand area. The new imbalance between buyers and sellers is now found between 1.3110 and 1.3140 - first chart - (safer area). Depending on risk profile, a second chart is attached below pin pointing the 1.3140/30 demand location, as per the rally-base-rally structure created during a brief sequence of eight 5 minutes candles, suggesting a strong imbalance in favour of demand, as price could only stay in the area barely 30 minutes.
eur/usd thoughts Today, the pair had a vigorous move through 1.3140/60 supply, causing the clearance of all the unfilled sell orders and producing in the process a fresh demand area. The new imbalance between buyers and sellers is now found between 1.3110 and 1.3140 - first chart - (safer area). Depending on risk profile, a second chart is attached below pin pointing the 1.3140/30 demand location, as per the rally-base-rally structure created during a brief sequence of eight 5 minutes candles, suggesting a strong imbalance in favour of demand, as...
eur/usd thoughts Today, the pair had a vigorous move through 1.3140/60 supply, causing the clearance of all the unfilled sell orders and producing in the process a fresh demand area. The new imbalance between buyers and sellers is now found between 1.3110 and 1.3140 - first chart - (safer area). Depending on risk profile, a second chart is attached below pin pointing the 1.3140/30 demand location, as per the rally-base-rally structure created during a brief sequence of eight 5 minutes candles, suggesting a strong imbalance in favour of demand, as...
Ignored
Let's say that was the new Supply Level. Usually how many times does that Supply level gets visited? for possible shorts? And is the idea of supply and demand to also Trade Short and Long positions? I'm assuming we're trying to go with the bigger trend....thank you in advance.
I moved to BE after price failed to break thru that conventional resistance. Since this was an AUDUSD 5m long against a 30m supply rejecting higher prices., management had to be very tight. Be cautious to play lower timeframes setups if higher ones are communicating the contrary.
{image} I would draw them smaller. There is no way of telling ( at this point ) when the levels are drawn, which one PA will stop at. Additional info would be needed as discussed in post # 5350. Review your ODDS ENHANCERS.. This will help a great deal. Hope this helps TSD
Ignored
TraderinS:
I see why your levels are better and with post 5350 it is making more sense.
Joined Feb 2011
|
Status: Probabilities, Not Absolutes
|1,246 Posts
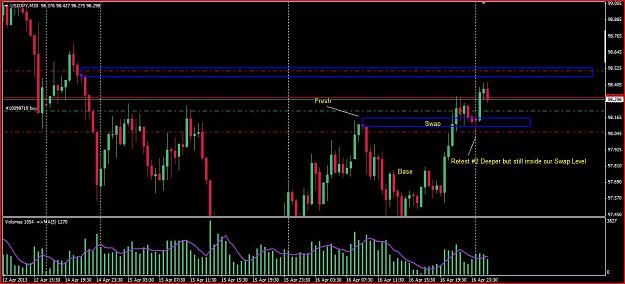
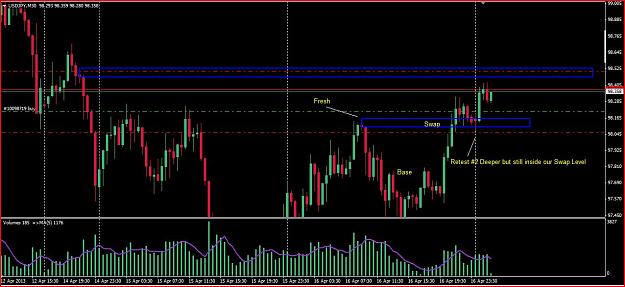
Attached Image (click to enlarge)
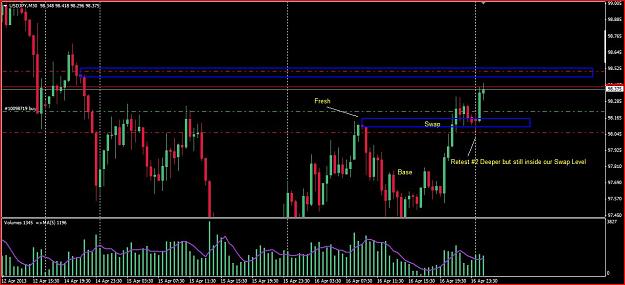
We are currently long on a 2 lot Swap trade. As you can see I was ridiculously late getting in ( please don't try this at home boys and girls )
Seriously, we are still able to maintain a 15 pip SL per lot with a 2:1 R/R. We endured some pain at the beginning but PA never really made an aggressive move short.
Price is stalling at this point .. just short of TP. So will need to keep a close eye.