With due permission of Mate T@rantula andBlackWid0w
--------------------
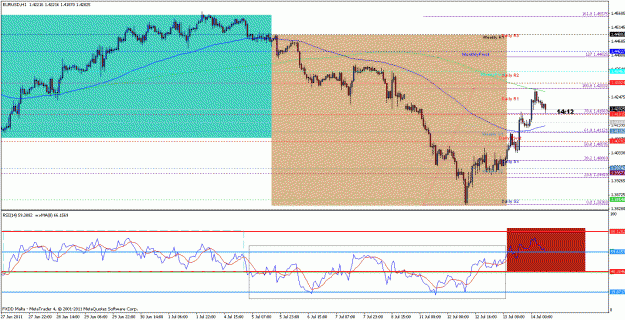
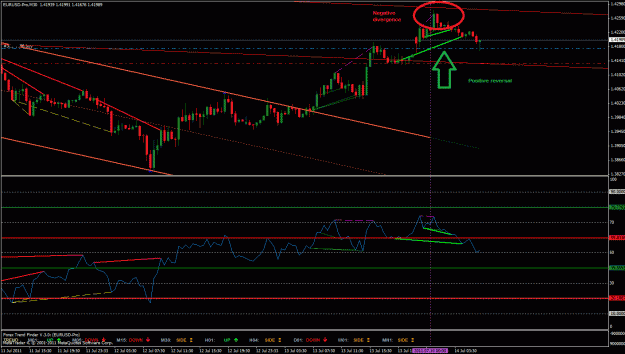
I have attached 1 HR EU Chart and would like to state few more points from my end on RSI.... what to look after you figure the RSI Bullish or Bearish term.... (or a SHift Change]
As T has said it before and at start of this thread
i would like to request to pay attention to those who look forward for RSI trading......
Setting your chart..
i) Once you place RSI (14) put 8 MA on the RSI window
Next
a) SR Levels play important level it can come in forms of trendline (H or V)...pivots, or FIB Level or a floating SR (MAs) ... Once identify those level now look at RSI
b) Is your RSI signaling Bearish or Bullish term identify it ..
c) Once done, now look for a signal... When we are in uptrend as directed by RSI.... Look for some support area to trade.... this can be figure out by checking if RSI is trading below 8 MA that means if RSI is below the 8 ema price is consolidating or you can say price is normally moving down (an example can be seen on the chart red market area on RSI-- when price found resistance at 200 SMA there were profit taker at that level of today Asian session out there that brings price to move down and RSI has cross below 8 MA too ) now those who are bullish will be looking for a strong support level below like you can say on FIB retracement or pivot levels etc or a trendline support... highly will be a confluence level of any two... once the buyers find the strong level price will move immediately to the main direction or you can say till RSI is above 8 ma we can say a strong trend is there.....
I have attached the chart for reference for example.
Presently RSI is below 8 EMA
Shift has been changed to Bullish that is trading between 80 and 40 level
I have drawn a FIB from 12th Low to Today High and i have 78.6 level at like .418x area immediate support could be found here and let see how price develops here...... As RSI is below 8 EMA the breach of this level will bring 61.8 FIB level in play with support of 100ma, weekly s1 before that we have a monthly support too...
Regards
Munal
--------------------
I have attached 1 HR EU Chart and would like to state few more points from my end on RSI.... what to look after you figure the RSI Bullish or Bearish term.... (or a SHift Change]
As T has said it before and at start of this thread
QuoteDislikedAgain I state that RSI IS NOT OB/OS indicator...Look 20>60 and 40>80 shift where we have upchannel in RSI.
Setting your chart..
i) Once you place RSI (14) put 8 MA on the RSI window
Next
a) SR Levels play important level it can come in forms of trendline (H or V)...pivots, or FIB Level or a floating SR (MAs) ... Once identify those level now look at RSI
b) Is your RSI signaling Bearish or Bullish term identify it ..
c) Once done, now look for a signal... When we are in uptrend as directed by RSI.... Look for some support area to trade.... this can be figure out by checking if RSI is trading below 8 MA that means if RSI is below the 8 ema price is consolidating or you can say price is normally moving down (an example can be seen on the chart red market area on RSI-- when price found resistance at 200 SMA there were profit taker at that level of today Asian session out there that brings price to move down and RSI has cross below 8 MA too ) now those who are bullish will be looking for a strong support level below like you can say on FIB retracement or pivot levels etc or a trendline support... highly will be a confluence level of any two... once the buyers find the strong level price will move immediately to the main direction or you can say till RSI is above 8 ma we can say a strong trend is there.....
I have attached the chart for reference for example.
Presently RSI is below 8 EMA
Shift has been changed to Bullish that is trading between 80 and 40 level
I have drawn a FIB from 12th Low to Today High and i have 78.6 level at like .418x area immediate support could be found here and let see how price develops here...... As RSI is below 8 EMA the breach of this level will bring 61.8 FIB level in play with support of 100ma, weekly s1 before that we have a monthly support too...
Regards
Munal
Attached Image (click to enlarge)