• Home
  • Forums
  • Trades
  • News
  • Calendar
  • Market
  • Brokers
  • Login
  • Join
  • 5:42pm
Menu
  • Forums
  • Trades
  • News
  • Calendar
  • Market
  • Brokers
  • Login
  • Join
  • 5:42pm
Sister Sites
  • Metals Mine
  • Energy EXCH
  • Crypto Craft

Options

Bookmark Thread

First Page First Unread Last Page Last Post

Print Thread

Similar Threads

Need indicator that shows pip difference of 2 currency pairs 2 replies

Buy/Sell Scripts for Correlated pairs 1 reply

who trades Correlated pairs? 0 replies

correlated pairs 2 replies

Pairs least correlated to GBP/JPY? 1 reply

  • Trading Systems
  • /
  • Reply to Thread
  • Subscribe
  • 5
Attachments: Hedging correlated pairs using pip difference
Exit Attachments
Tags: Hedging correlated pairs using pip difference
Cancel

Hedging correlated pairs using pip difference

  • Post #1
  • Quote
  • First Post: Jun 26, 2011 7:49am Jun 26, 2011 7:49am
  •  Hugh Briss
  • | Commercial Member | Joined May 2011 | 3,012 Posts
I have been following Dreamliners excellent thread for a number of days and came up with an alternative to using variance in stochastics to trigger a trade. My basic idea is to calculate the difference in pips between one pair and another and watch the ebbs and flows to give you clues as to where it might go next. The reality is working out slightly better than I had anticipated so I thought I would start a seperate thread to discuss this method and improvements to it.

I am not a coder and so have had to use a custom indicator buillder from the internet but so far I have built something close to what I want. All of the indicators required can be found on the following page. There are templates and instructions too. I won't post them here because they will undoubtedly be changed and improved as time goes on.

http://www.forexfactory.com/showthre...60912&page=215

First off let's go through the previous system using stochs. Basically the idea involves waiting for the stochs in two correlated pairs such as gbpusd and audusd to vary by a difference of around 80%. This means in theory that one pair is getting ahead of each other and the two are probably due a correction to the norm. The idea is then to sell the pair with the highest stochs and buy the pair with the lower stochs so that as the prices move together again you will make a profit on one or both of the pairs. Profits are generally quite modest and it is sometimes necessary to sit through a period of drawdown before go your way.

I was thinking about this and it came to me that if you are considering two pairs such as gbpusd and audusd then it would surely be possible to calculate the difference in pips between the two pairs and ascertain a range. Once the pips difference got near the top of the range then you would be able to sell the pair with the highest pip value and buy the pair with the lower pip value in the expectation that as the correlation kicked back in the difference in pips would decrease hence making money on your hedge.

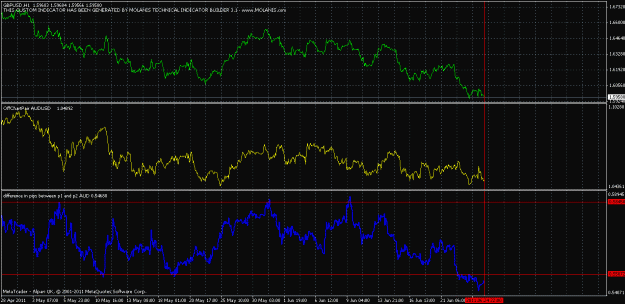
I have attached some charts below illustrating what I mean. The first is a one hour chart of gbpusd with audusd underneath. This shows how the pip difference indicator works. Notice the ebbs and flows and the resistance at the first line at the top.

The second chart is a possible trade in gbpusd vs audusd. I have very roughly marked where you may have taken a trade as the pips difference bounced from resistance and headed lower. I have tried to roughly mark the entry and exit points and as you can see you would have taken nearly 20 pips from both pairs as they moved closer together.

The third chart is a 4hour chart zoomed out with s and r levels on it. This can't be a coincidence that certain levels keep being touched and so must be as a result of s and r on the price chart.

The last chart is an hourly chart again as it is looking as I write this on a Sunday afternoon. On Monday I would be looking for the pips difference to either close above the line in which case I would want to buy gbp and sell aud as I would expect the pip difference to be getting larger. If it moves and closes a little lower than the previous consolidation I would trade the other way expecting the pip difference to go lower.

This may well be as clear as mud at the moment so I will have to watch it for a few days myself in order to post trade examples. I have in no way perfected the entry and exit points so discussion is definitely needed on that.

One thing worth mentioning is that we are only trading pairs with a correlation of more than 80% over the last 50 days and the 4 hour chart goes back quite a bit more than that so the correlation is going to have changed. What interests me is the s and r effect on the one hour time frame over maybe 50 periods. It does tend to range bouncing from one s and r to another which makes me think there is an opportunity to take money from the markets following these ebbs and flows of the correlation and the pip difference. We'll see. Thanks for reading this far, post a comment!
Attached Image(s) (click to enlarge)
Click to Enlarge

Name: gbpusd vs audusd hourly zoomed out.gif
Size: 31 KB
Click to Enlarge

Name: possible trade gbp vs aud.gif
Size: 30 KB
Click to Enlarge

Name: 4hr s and r on pip difference.gif
Size: 30 KB
Click to Enlarge

Name: 1hr trade view bounce or close above.gif
Size: 24 KB
  • Post #2
  • Quote
  • Jun 26, 2011 9:10am Jun 26, 2011 9:10am
  •  Eamonn
  • | Joined Feb 2008 | Status: Member | 147 Posts
Really like the logic of this system it may very well have been staring everyone in the face and nobody noticed.

The pip difference and no other indicator is really what matters !!!
 
 
  • Post #3
  • Quote
  • Jun 26, 2011 10:12am Jun 26, 2011 10:12am
  •  josch
  • | Joined Jun 2010 | Status: Member | 543 Posts
Hugh,

simple but irresistible idea. Over the time you will have the problem, that PIP difference will move away (up- or downwards). I checked H1 GBPUSD x AUDUSD 1 year back.

If you draw S/R lines in the sand around 200 PIPs difference between them, you made a lot of 200 PIP-moves (profits), but sometimes lines are moving down out of the windows (in this example).

How about combining this with a PIP-difference-following instrument like some MAs or a BB. You may adapt your area of trades. This is going towards the technique of grid trading. If you are able to move your grid, you are able to remain in the profitable area by moving entry/exit. Wise choosen you may forget SLs (except a catastrophic one).

josch
trading is war - life is simple
 
 
  • Post #4
  • Quote
  • Jun 26, 2011 12:02pm Jun 26, 2011 12:02pm
  •  Hugh Briss
  • | Commercial Member | Joined May 2011 | 3,012 Posts
Quoting Eamonn
Disliked
Really like the logic of this system it may very well have been staring everyone in the face and nobody noticed.

The pip difference and no other indicator is really what matters !!!
Ignored
Thanks for the comments, I was thinking I would have to calculate it daily by hand and work that way but I managed to knock something up.
 
 
  • Post #5
  • Quote
  • Jun 26, 2011 12:10pm Jun 26, 2011 12:10pm
  •  Hugh Briss
  • | Commercial Member | Joined May 2011 | 3,012 Posts
Quoting josch
Disliked
Hugh,

simple but irresistible idea. Over the time you will have the problem, that PIP difference will move away (up- or downwards). I checked H1 GBPUSD x AUDUSD 1 year back.

If you draw S/R lines in the sand around 200 PIPs difference between them, you made a lot of 200 PIP-moves (profits), but sometimes lines are moving down out of the windows (in this example).

How about combining this with a PIP-difference-following instrument like some MAs or a BB. You may adapt your area of trades. This is going towards the technique of grid trading....
Ignored
Yes over time the correlations themselves will change but all the time that a pair of pairs are correlated quite closely then the pip distance will more than likely range quite a bit which I believe should give us ample opportunity to work with and when it drops out of a range that gives a chance to trade that way too! Don't forget also that we are using the "tradeable correlations" indicator to find the best pairs to trade together.

I did put together a version with a 100ma but it didn't look that useful on a chart maybe I'll try 50 periods? At the moment I can't code the indicator properly myself so I had to rely on the indicator builder which means I'm not sure if I could put the ma length as a user defined variable. I really will have to try to get something better coded by hand.

Looking at the higher timeframes it's obvious that even though pairs may be highly correlated the pip difference can still change and in fact even trend in one direction for quite a while. Maybe this is an altogether safer way to take advantage of long term trends?
 
 
  • Post #6
  • Quote
  • Jun 27, 2011 1:22am Jun 27, 2011 1:22am
  •  Hugh Briss
  • | Commercial Member | Joined May 2011 | 3,012 Posts
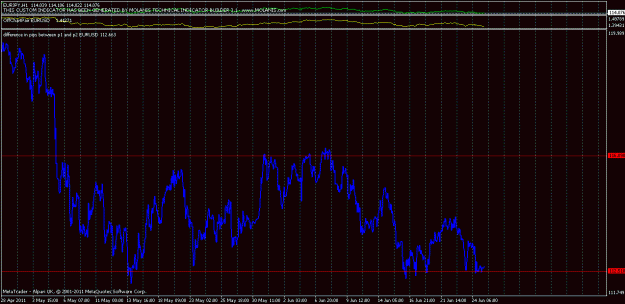
This is eurjpy vs eurusd. It looks to me as though the pip difference may widen as it seems to have found support at that level. I have placed a buy on eurjpy and a sell on eurusd. If the pip difference drops below the line I will close out with whatever loss I need to take. If it goes up I will take profit when it starts to turn significantly back down although somewhere around a 30 pip profit would be tempting to take. Of course I need to find out what the average loss is if you buy support and sell resistance and close out for a loss the other side of the line but that will come with time. I'm guessing it would be in the region of 20 to 30 pips so a 30 to 60 pip gain each time would be desirable. Then it's just down to how many times you can pick the direction correctly.
Attached Image (click to enlarge)
Click to Enlarge

Name: eurjpy vs eurusd trade.gif
Size: 27 KB
 
 
  • Post #7
  • Quote
  • Jun 27, 2011 1:45am Jun 27, 2011 1:45am
  •  bravester
  • | Joined Aug 2007 | Status: No Guts No Glory | 340 Posts
I think you would have better success with this strat when slower moving/ranging pairs are selected... ex:

EURGBP and EURCHF
NZDUSD and NZDJPY

etc...
 
 
  • Post #8
  • Quote
  • Jun 27, 2011 2:15am Jun 27, 2011 2:15am
  •  Hugh Briss
  • | Commercial Member | Joined May 2011 | 3,012 Posts
Quoting bravester
Disliked
I think you would have better success with this strat when slower moving/ranging pairs are selected... ex:

EURGBP and EURCHF
NZDUSD and NZDJPY

etc...
Ignored
You could be right. I'll have to try a few things out before I settle on a proper strategy.
 
 
  • Post #9
  • Quote
  • Jun 27, 2011 2:18am Jun 27, 2011 2:18am
  •  the-game
  • | Joined Sep 2010 | Status: Member | 721 Posts
I'm not sure if I understand everything correctly, and I don't mean to throw a spanner in the works, but in post 1 where you use GBPUSD and AUDUSD and created the difference in pips chart...

...aren't you just roughly creating the GBPAUD chart?
 
 
  • Post #10
  • Quote
  • Jun 27, 2011 5:23am Jun 27, 2011 5:23am
  •  Hugh Briss
  • | Commercial Member | Joined May 2011 | 3,012 Posts
Quoting the-game
Disliked
I'm not sure if I understand everything correctly, and I don't mean to throw a spanner in the works, but in post 1 where you use GBPUSD and AUDUSD and created the difference in pips chart...

...aren't you just roughly creating the GBPAUD chart?
Ignored
Not really, all you are charting is the difference between one pair and the other, that doesn't calculate the value of gbpaud it just gives you information about their relative prices although over time it may look similar to gbpaud.
 
 
  • Post #11
  • Quote
  • Jun 27, 2011 10:54am Jun 27, 2011 10:54am
  •  squalou
  • Joined Mar 2010 | Status: Member | 588 Posts
Hi there,

Josch directed me to this thread to find some help...

Looking what your indicators are drawing, it does not seem to be anywhere near a "pip difference", but simply the "price difference", between the 2 pairs.

As you have only posted .ex4 files, i can only guess this from what i can see.

But the "data window" confirms this easily.

So, for EURJPY vs EURUSD , your "difference pip..." indicator will roughly show you EURJPY alone -- drag the OffLinChart indicator on top of your "difference pip" window, and you'll see they graphically overlap, because the difference is too small to be seen (<1%).
The data window will confirm again.

With GBPUSD vs EURUSD, as they are evolving in the same "price magnitude" (1.xxxx), it will not be true anymore, but it will now be exactly the same as plotting the "Basket 2 pairs sq" with equal lotsizes each (1 buy and 1 sell) as in the "Hedge and Correlation Strategy" (where you posted your indis and templates).

Josch's post on the other thread lists the indicators i had posted there.
http://www.forexfactory.com/showthre...39#post4726339

Sorry to sound negative, but i think this is going nowhere as it is described at the moment.

Sq
 
 
  • Post #12
  • Quote
  • Jun 27, 2011 1:09pm Jun 27, 2011 1:09pm
  •  Hugh Briss
  • | Commercial Member | Joined May 2011 | 3,012 Posts
Quoting squalou
Disliked
Hi there,

Josch directed me to this thread to find some help...

Looking what your indicators are drawing, it does not seem to be anywhere near a "pip difference", but simply the "price difference", between the 2 pairs.

As you have only posted .ex4 files, i can only guess this from what i can see.

But the "data window" confirms this easily.

So, for EURJPY vs EURUSD , your "difference pip..." indicator will roughly show you EURJPY alone -- drag the OffLinChart indicator on top of your "difference pip" window, and you'll see they...
Ignored
You are absolutely right, you can't mix yen pairs with usd pairs. I still think it's viable on, say gbpusd against audusd.

You are right again about the indicator, it simply calculates the difference in price, in pips, of two pairs. The logic remains though that as the correlated pairs fluctuate this indicator will fluctuate. Whether or not this does actually make more sense than just trading price on a chart is not yet known.

Thanks for your input.
 
 
  • Post #13
  • Quote
  • Jun 28, 2011 5:38pm Jun 28, 2011 5:38pm
  •  guigors
  • | Joined Jun 2011 | Status: Member | 11 Posts
Hello everone,

I´ve been demo testing some correlation strategies for about 2 months (Dreamliner´s stochastic and based on it, a pip gap correlation strategy I came up with). Seems to me that the gap correlation is more predictable than stochastics but I end up confused on how a correlation can be realiably calculated over time.

Apparently, this thread is also about trading the gap on a correlation, but is it really reliable to calculate a chart overlay based on correlation? I´ve seem a lot of overlay indicators out there, including this one attached, but depending on when you start calculating, your overlay chart will produce different signals.

I think for this strategy is the best, but we really should be certain on how the overlay would be calculated over time.

Been trying to fix the overlay chart since. Have you guys some thoughts about it? Problems during tests?

Cheers.
 
 
  • Post #14
  • Quote
  • Aug 5, 2011 6:05am Aug 5, 2011 6:05am
  •  bravester
  • | Joined Aug 2007 | Status: No Guts No Glory | 340 Posts
This is an excellent concept. i dont know why this hasn't been taken further(or maybe someone's looking at it offline ?). I have also thought of this idea before. from what i recall you need 2 slow moving , ranging pairs for best results.

i'll run some backtests on data to see if this idea is feasible at all.
 
 
  • Post #15
  • Quote
  • Aug 5, 2011 7:39pm Aug 5, 2011 7:39pm
  •  Hugh Briss
  • | Commercial Member | Joined May 2011 | 3,012 Posts
Quoting bravester
Disliked
This is an excellent concept. i dont know why this hasn't been taken further(or maybe someone's looking at it offline ?). I have also thought of this idea before. from what i recall you need 2 slow moving , ranging pairs for best results.

i'll run some backtests on data to see if this idea is feasible at all.
Ignored
The indicator I posted is interesting but doesn't help you predict much. I noticed that there are areas of s/r that you could trade to tell you when the pairs correlation was likely to strengthern or weaken but if you're going to trade areas of s/r on a chart then why not just use the price? After a lot of thought I decided that there wasn't much point for me personally in continuing this idea. In fact I'm not sure that correlations aren't just a red herring anyway as they can and do change over time. If gbpusd and audusd are both moving up at the same time it is simply due to the weakness of the usd. How that helps you in trading either one or both isn't clear to me. Good luck if you do find something worth using.
 
 
  • Post #16
  • Quote
  • Apr 10, 2012 11:08pm Apr 10, 2012 11:08pm
  •  cdto2012
  • | Joined May 2011 | Status: Member | 7 Posts
Hi, I posted a lengthy write up here if you want to take a look.
http://www.traderslaboratory.com/for...revisited.html

I am getting into scalping on the one minute bars, but that is not the focus of the thread, the indicator has made me plenty of profit.
 
 
  • Post #17
  • Quote
  • Last Post: Oct 31, 2013 1:44pm Oct 31, 2013 1:44pm
  •  JumpJack
  • | Joined Mar 2010 | Status: Member | 136 Posts
Hugh Briss, or anyone, where can I find the indicators described here - hedging using pip difference or price difference??? thnx JJ
 
 
  • Trading Systems
  • /
  • Hedging correlated pairs using pip difference
  • Reply to Thread
0 traders viewing now
Top of Page
  • Facebook
  • Twitter
About FF
  • Mission
  • Products
  • User Guide
  • Media Kit
  • Blog
  • Contact
FF Products
  • Forums
  • Trades
  • Calendar
  • News
  • Market
  • Brokers
  • Trade Explorer
FF Website
  • Homepage
  • Search
  • Members
  • Report a Bug
Follow FF
  • Facebook
  • Twitter

FF Sister Sites:

  • Metals Mine
  • Energy EXCH
  • Crypto Craft

Forex Factory® is a brand of Fair Economy, Inc.

Terms of Service / ©2023