• Home
  • Forums
  • Trades
  • News
  • Calendar
  • Market
  • Brokers
  • Login
  • Join
  • User/Email: Password:
  • 9:31am
Menu
  • Forums
  • Trades
  • News
  • Calendar
  • Market
  • Brokers
  • Login
  • Join
  • 9:31am
Sister Sites
  • Metals Mine
  • Energy EXCH
  • Crypto Craft

Options

Bookmark Thread

First Page First Unread Last Page Last Post

Print Thread

Similar Threads

Indicator for average candle size for up or down candle? 1 reply

How to make EA that send Open Price of Candle for every new candle 5 replies

bitfx.ch - small free news aggregation service for day traders 5 replies

free program to speed up the aggregation of the trading system 7 replies

Candle aggregation inaccuracies.... 2 replies

  • Platform Tech
  • /
  • Reply to Thread
  • Subscribe
  • 24
Attachments: NEW!! - Candle Aggregation indicator
Exit Attachments

NEW!! - Candle Aggregation indicator

  • Last Post
  •  
  • Page 1 23 4
  • Page 1 23 4
  •  
  • Post #1
  • Quote
  • First Post: Edited Jan 30, 2014 2:20pm May 15, 2007 12:16am | Edited Jan 30, 2014 2:20pm
  •  hanover
  • Joined Sep 2006 | Status: ... | 8,081 Posts
NOTE (Jan 31, 2014): Any indicators or EAs that I've contributed to this thread will probably no longer work in the latest MT4 build that is (if I understand correctly) due to be rolled out on Feb 3. If you want to ensure that these indicators/EAs continue to work correctly, do NOT upgrade your MT4 beyond the current build (509). I don't know how to re-code them to make them run correctly in the new look MT4, and I've no desire to re-educate myself to learn the new programming language that MetaQuotes is forcing upon everybody. Personally I think that their short-sighted development policy totally stinks, but there's nothing I can do about it. So if you decide to upgrade, you're on your own. Please note the Terms and Conditions below.
______________________

In the James16 chart thread (http://www.forexfactory.com/showpost...postcount=3522) I expressed the possibility of creating more pin bars, BUOBs, BEOBs, etc, to increase possible trading opportunities, by aggregating price bars into new timeframes (e.g. H1 into H2, H3, H6, H8, etc; D1 into D2, D3 etc), and also possibly with ‘shifted’ starting times (e.g. H4 bars at 1:00, 2:00, 3:00, 5:00 etc, instead of the usual 0:00, 4:00, 8:00, etc).

The attached CandleAggregator.MQ4 indicator is my attempt to facilitate this. I’m afraid the coding is a little rough; I’m fairly new to MQL4 programming.

Install in the usual manner, i.e. unzip into the \experts\indicators\ folder.

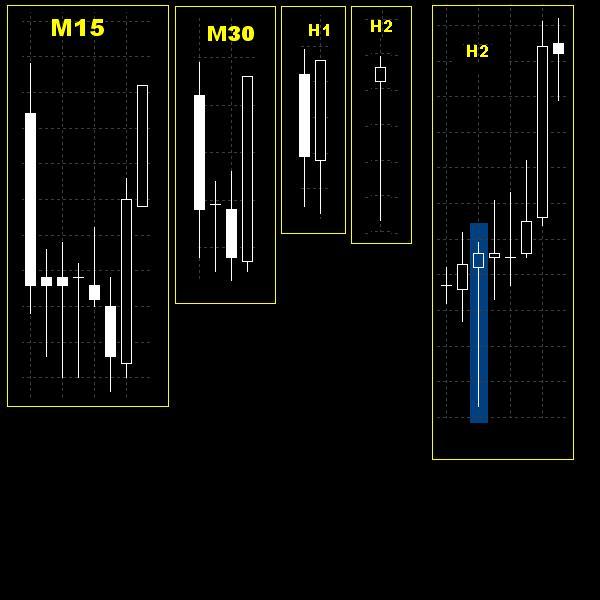
Attach the indicator to your chart (there are no DLL imports), and set the parameters to suit, as explained below. Like Heiken-Ashi, the aggregated candles display over the top of the OHLC candles on your chart. To see the aggregated candles more clearly, first press F8 and change the ‘Line graph’ color to None, then switch to a line chart (press Alt-3). Press Alt-2 to restore the component OHLC candles.

The parameters work as follows:

AggrFactor: the number of component candles to be aggregated into a single one. For example, if you want H3 candles, move to an H1 chart and set the AggrFactor to 3.

TimeShift: This is the number of bars to the left to ‘shift’ the start of the aggregation process. The default is zero which means no shift. Obviously, to be meaningful, this value should be less than AggrFactor. Can also be used to perform a timezone shift of a standard chart (AggrFactor = 1). Experiment to suit.

AggrBackward: default is ‘false’, which causes the aggregated candle to be displayed over the leftmost candle in the group being aggregated. ‘True’ means that the aggregated candle will display over the rightmost candle in the group. The size and the shape of the candle is not affected by this setting, just the place where it is plotted on the chart.

InterCandles: ‘true’ causes all of the intermediate candles to be displayed, i.e. component candles are being aggregated into multiple consecutive candles. Probably not very useful!

SwitchOff: ‘true’ suppresses the plotting of the aggregate candles, allowing you to view the component OHLC candles, without having to remove the indicator from the chart.

A green candle means the Close is higher than the Open; a red candle, vice versa.

If the aggregated candles are spaced too far apart for your liking, press the minus key to ‘zoom in’, as required.

There seems to be a small problem when a new tick causes the chart to start plotting a new OHLC candle. (Seems to be an MT4 quirk; perhaps a more experienced programmer could suggest a fix?). Meantime, editing the indicator (Ctrl-I etc) redraws the aggregate candles correctly.

Screenshot in attached ZIP.

David
Attached File
File Type: zip CandleAggregator.ZIP   73 KB | 3 downloads
  • Post #2
  • Quote
  • May 15, 2007 1:54am May 15, 2007 1:54am
  •  Kurka Fund
  • Joined Mar 2007 | Status: Member | 437 Posts
How about some Tick Candles.... Im looking for candles that are formed based off of the last 100 ticks, regardless of time... every 100 ticks makes a new candle. . . during the slow hours you might get one candle formed every 5 min, but then in the really volitile periods you could get a new candle every 30 seconds or so.

Is there any way to do this ?
Keep it simple stoopid....
 
 
  • Post #3
  • Quote
  • Edited at 2:36am May 15, 2007 2:08am | Edited at 2:36am
  •  mr.marketz
  • Joined May 2006 | Status: Member | 397 Posts
Very handy, thanks Hanover.
 
 
  • Post #4
  • Quote
  • May 15, 2007 3:53am May 15, 2007 3:53am
  •  mason
  • | Joined Dec 2006 | Status: Member | 105 Posts
hanover,

You're a great programmer, this is a very genious idea, you put and share this into the field as well.

I wanna thank for Plot News indicator also, it's a remarkable work.

I have a few observation to consider, may I ...

Chart #1 and #2, show different candles, because 1 minute lag

Chart #1 and #3, show the same candles, because 3 minutes lag

Chart #4, candles are drawn continuously

Settings :
AggrFactor = 3
Rest are default

Could we get additional parameters to set where exactly the first candle should be drawn, for minutes' TF such as 1M,5M,15M,30M, we can begin with XX:00, if hours' TF such as 1H,4H, begin with 00:00, if daily TF, DayOfYear()=1, if weekly, begin with certain date, if monthly, begin with Month()=1,
and a starting date (for intraday TF) to draw, all these can point out to the exact first starting candle to be calculated and drawn.
Attached Images
 
 
  • Post #5
  • Quote
  • May 15, 2007 4:42am May 15, 2007 4:42am
  •  hanover
  • Joined Sep 2006 | Status: ... | 8,081 Posts
Mr marketz, thanks for the feedback.

Kurka, sorry, I don’t know how to access ticks. I’ve looked in the MQL4 language reference under ‘Predefined variables’ and ‘Timeseries access’ and can’t find anything suitable. Some of the other more experienced programmers, especially those who’ve developed EAs, may know.

Quoting mason
Disliked
Chart #1 and #2, show different candles, because 1 minute lag
Chart #1 and #3, show the same candles, because 3 minutes lag
Chart #4, candles are drawn continuously
Ignored
Mason, I’m not quite sure what you mean here. I did a number of tests on higher timeframe charts, making sure that the OHLC of the component candles correctly matched the OHLC of the relevant green/red aggregate candle. If that’s not working properly, I need to fix it. I must admit I intended the indicator to be used on higher timeframe charts, but it should work correctly on any timeframe. In fact, you should be able to change timeframe and it will plot, according to the same parameters, on the new chart. In your chart 4.gif, there is a ‘bunching up’ of candles at the right. That’s what I was referring to when I said “There seems to be a small problem when a new tick causes the chart to start plotting a new OHLC candle. (Seems to be an MT4 quirk….” Simply editing the indicator causes a complete re-plot, which tidies everything up.

Quoting mason
Disliked
Could we get additional parameters to set where exactly the first candle should be drawn, for minutes' TF such as 1M,5M,15M,30M, we can begin with XX:00, if hours' TF such as 1H,4H, begin with 00:00, if daily TF, DayOfYear()=1, if weekly, begin with certain date, if monthly, begin with Month()=1,
and a starting date (for intraday TF) to draw, all these can point out to the exact first starting candle to be calculated and drawn.
Ignored
I assume you mean work left-to-right across the chart from a fixed starting point, as opposed to the current approach, which works right-to-left from the most current bar. I will look into this. I agree that it makes more sense to do it the way you’ve described, because it allows one to fix the timeframe.

David
 
 
  • Post #6
  • Quote
  • May 15, 2007 5:03am May 15, 2007 5:03am
  •  mason
  • | Joined Dec 2006 | Status: Member | 105 Posts
hanover,

Yes, you understand me correctly, left to right.
 
 
  • Post #7
  • Quote
  • May 15, 2007 4:32pm May 15, 2007 4:32pm
  •  hanover
  • Joined Sep 2006 | Status: ... | 8,081 Posts
Mason, what you're asking is actually quite difficult.

What happens when we start aggregating bars from a certain point in time? Let's say we choose 1 hour bars, and choose to aggregate 5 bars into each candle. Because 24 is not divisible by 5, the aggregated bars will start at a different time each day. That means that we either live with this shortcoming, or we restart the aggregation at 0000 GMT (or whatever time the user specifies - people live in different time zones) each day. If the latter, then some price bars will comprise less than 5 hours data. That raises the question: do we need to accommodate both viewpoints?

What happens if we choose factors of 24 only? The same problem will occur, aggregating groups of (for example) 6 bars, due to irregularities of Sunday, irregular market hours due to statutory holidays like New Year and Easter, and sometimes where there are data problems causing price bars to be missing altogether. Different market-makers maintain different hours, so there are likely to be many possible permutations.

That deals with the 1 hour timeframe, within the context of 1 day. We are going to have the same kind of issue with 1 day in the context of 1 week, and so on. In fact, something similar will occur in every possible set of timeframes. There are any number of potential times that we could restart the aggregation process, in each timeframe.

I guess we could try to work through all of the permutations, but I'm afraid I'm going to have to file it in the "too hard basket", at least for the meantime.

David
 
 
  • Post #8
  • Quote
  • May 15, 2007 6:20pm May 15, 2007 6:20pm
  •  mason
  • | Joined Dec 2006 | Status: Member | 105 Posts
hanover,

thanks for putting your time in considering my proposal.

Actually, what you have done now is already painting left-to-right, but from the very beginning of the Bars : pos=Bars-CountedBars-1; which we cannot control, what I propose is to control the first point, may be we could add just 2 additional parameters which first date and first time, accordingly any TF will adjust itself to the nearest possible (I think MT4 might do this automatically, especially for W1 and MN)

As for drawn continuously, I think the expression of MathMod(pos,AggrFactor) == TimeShift could be improved, since pos always refer to 0 after indicator paints all bars.

And for odd or even number, let the user experience that, we only count bars from the first point, it is up to them to experience unusual calculation.
 
 
  • Post #9
  • Quote
  • May 15, 2007 6:29pm May 15, 2007 6:29pm
  •  SeekingLight
  • Joined Jul 2006 | Status: Charts + PA > * | 3,251 Posts
Personally I'd say try not to over-curve fit the market to your liking, it might come back to haunt you....

I'd recommend using GMT and weekly / daily / 4h (once advanced) on it and not fussing too much over the "merged" candles....there are good setups aplenty on "normal" bars as it is.

Anything below 4h becomes very, very advanced and tricky stuff :S
Trust price. Know yourself.
 
 
  • Post #10
  • Quote
  • May 16, 2007 8:05am May 16, 2007 8:05am
  •  hanover
  • Joined Sep 2006 | Status: ... | 8,081 Posts
Quoting mason
Disliked
hanover,
thanks for putting your time in considering my proposal......
Ignored
Mason, you (or anybody else) is most welcome to change the indicator to suit your own requirements. I intentionally post the source code of all my work so that it's available for anybody to use however they please.

I know there are some folk who worry about copyright or intellectual property, and don't post source code for fear that somebody else might profit by selling it on e-bay. If anybody wants to take any of my ideas, and sell them for their own profit, it really doesn't bother me. I'm simply here to help anybody in any way that I can, with whatever time, knowledge and resources I have available.

Cheers
David
 
1
  • Post #11
  • Quote
  • May 23, 2007 6:23am May 23, 2007 6:23am
  •  hanover
  • Joined Sep 2006 | Status: ... | 8,081 Posts
Hi Mason

You might be interested in the "periodcon" indicator, which I notice now incorporates a TimeShift facility - not sure if it achieves exactly what you want, but see posts #5, 8 and 9 here:
http://www.forexfactory.com/showthread.php?p=1448514

David
 
 
  • Post #12
  • Quote
  • May 23, 2007 6:32am May 23, 2007 6:32am
  •  hanover
  • Joined Sep 2006 | Status: ... | 8,081 Posts
Quoting SeekingLight
Disliked
Personally I'd say try not to over-curve fit the market to your liking, it might come back to haunt you....

I'd recommend using GMT and weekly / daily / 4h (once advanced) on it and not fussing too much over the "merged" candles....there are good setups aplenty on "normal" bars as it is.

Anything below 4h becomes very, very advanced and tricky stuff :S
Ignored
SeekingLight,

I agree that as the chart timeframe gets smaller, volatility causes the pin bars become decreasingly reliable. But unlike you, I find opportunities on the H4/D1/W1 charts very hard to come by.

Here's an example of a recent pinbar on the GBPJPY pair, in a "synthetic" H2 chart. Note how it breaks down into the "railway tracks" on the H1 chart, and the 'U' shape on the lower charts. As can be seen from the chart excerpt at right, this one happened to be very profitable.

Of course I realize that this is just one example, and one would need to research whether or not a sufficient percentage of them were profitable, to make the exercise worthwhile.

David
Attached Image
 
 
  • Post #13
  • Quote
  • May 23, 2007 6:36am May 23, 2007 6:36am
  •  mason
  • | Joined Dec 2006 | Status: Member | 105 Posts
David,

Thanks, I will check it out, it's easy to get burned out, but still letting myself hanging around in all possible realm.

Anyway, I did a little modification, but current status is worse, I will fix it when I am ready.
 
 
  • Post #14
  • Quote
  • May 23, 2007 6:39am May 23, 2007 6:39am
  •  SeekingLight
  • Joined Jul 2006 | Status: Charts + PA > * | 3,251 Posts
Quoting hanover
Disliked
SeekingLight,

I agree that as the chart timeframe gets smaller, volatility causes the pin bars become decreasingly reliable. But unlike you, I find opportunities on the H4/D1/W1 charts very hard to come by.
Ignored

I'd say you'd be able to find one 4h PB per week no problemo.
There are over 8 pairs you could look at for them, some monitor 16+

Risking 1% on each one, assuming on average you could get 2% out of each, you'd have 8% in a month, 4% if you only got 1:1 out of it.

Obviously the weekly PBs are meant for a lot longer term and occur more rarely as well. But look how they can go -> the EURCHF example James posted on his thread.

Also you could always just visually merge 2 1h or 4h bars if you're so hot for PBs

I just would recommend finding LESS setups, but preferably superb ones to start with instead of "generating" additional ones.

Just my opinion
Trust price. Know yourself.
 
 
  • Post #15
  • Quote
  • May 23, 2007 7:09am May 23, 2007 7:09am
  •  hanover
  • Joined Sep 2006 | Status: ... | 8,081 Posts
Quoting SeekingLight
Disliked
I'd say you'd be able to find one 4h PB per week no problemo.
There are over 8 pairs you could look at for them, some monitor 16+

Risking 1% on each one, assuming on average you could get 2% out of each, you'd have 8% in a month, 4% if you only got 1:1 out of it. ......

I just would recommend finding LESS setups, but preferably superb ones to start with instead of "generating" additional ones.

Just my opinion
Ignored

Thanks for this, Seeking, the 4%-8% per month is an excellent approach to bottom line MM. Must admit I hadn't looked at it this way.

As for quality not quantity: I will need to review the James16 thread to learn which PB shapes and styles give the best probability for profit. I gather that long nose, reasonably level eyes is preferable; also their context, i.e. at the end of a run, or at/near a Fibo retracement or EMA(365). Beyond that, I will have to do more reading.

Of course there are other patterns that Jim discusses: BUOBs, DBLHC, etc, all potential opportunities also.

BTW, nice poem in your signature

David
 
 
  • Post #16
  • Quote
  • Jul 8, 2007 12:27am Jul 8, 2007 12:27am
  •  mason
  • | Joined Dec 2006 | Status: Member | 105 Posts
David,

Here is my modification, it's left-aligned now, but there is still a bug, that bars after indicator placements don't paint correctly.

Hope you or someone can give a better shot.
Attached Image
Attached File
File Type: mq4 CandleAggregator v2.mq4   6 KB | 917 downloads
 
 
  • Post #17
  • Quote
  • Jul 9, 2007 8:43am Jul 9, 2007 8:43am
  •  hanover
  • Joined Sep 2006 | Status: ... | 8,081 Posts
Hi Mason

Thanks for your hard work. Had a quick look, will take a more in-depth one when I have more time. Wish MT4 had a decent debugger.

I developed CandleAggregator because Period Converter lacked a TimeShift facility, only to find that this has been rectified. So I’ve been using periodcon.mq4 (http://www.forexfactory.com/showthread.php?t=22114) instead, to build my synthetic charts.

I also had a problem with the original CandleAggregator, specifically the rightmost candles. Seemed to be a quirk with MT4, although I’m not 100% sure when/how often MT4 reprocesses the ‘start()’ logic and refreshes the chart. Editing an indicator seems to force a refresh. I wonder if your problem is related to mine.

Thanks again
David
 
 
  • Post #18
  • Quote
  • Jul 9, 2007 9:55am Jul 9, 2007 9:55am
  •  sergiu
  • | Joined May 2006 | Status: Least Qualified Poster | 444 Posts
Quoting hanover
Disliked
Hi Mason

Thanks for your hard work. Had a quick look, will take a more in-depth one when I have more time. Wish MT4 had a decent debugger.

I developed CandleAggregator because Period Converter lacked a TimeShift facility, only to find that this has been rectified. So I’ve been using periodcon.mq4 (http://www.forexfactory.com/showthread.php?t=22114) instead, to build my synthetic charts.

I also had a problem with the original CandleAggregator, specifically the rightmost candles. Seemed to be a quirk with MT4, although I’m not 100% sure when/how often MT4 reprocesses the ‘start()’ logic and refreshes the chart. Editing an indicator seems to force a refresh. I wonder if your problem is related to mine.

Thanks again
David
Ignored
The start() function is executed every time a new tick comes in...
Stubbornly persistent
 
 
  • Post #19
  • Quote
  • Jul 12, 2007 11:49pm Jul 12, 2007 11:49pm
  •  mason
  • | Joined Dec 2006 | Status: Member | 105 Posts
Quoting hanover
Disliked
Hi Mason

Thanks for your hard work. Had a quick look, will take a more in-depth one when I have more time. Wish MT4 had a decent debugger.

I developed CandleAggregator because Period Converter lacked a TimeShift facility, only to find that this has been rectified. So I’ve been using periodcon.mq4 (http://www.forexfactory.com/showthread.php?t=22114) instead, to build my synthetic charts.

I also had a problem with the original CandleAggregator, specifically the rightmost candles. Seemed to be a quirk with MT4, although I’m not 100% sure when/how often MT4 reprocesses the ‘start()’ logic and refreshes the chart. Editing an indicator seems to force a refresh. I wonder if your problem is related to mine.

Thanks again
David
Ignored
David,

Thanks for the link, I use it for another approach, anyway here is another try, hope at the end we get a solid one.
Attached Image
Attached File
File Type: mq4 CandleAggregator v3.mq4   7 KB | 1 download
 
 
  • Post #20
  • Quote
  • Jul 13, 2007 1:26am Jul 13, 2007 1:26am
  •  nitman
  • | Joined Nov 2005 | Status: Member | 386 Posts
If other people are not seeing the same thing you are ... would your method still work? Even in price action ... people follow similar patterns in order to move the market. You might be all by yourself in the 2H TF...or just lagging behind 1H.
 
 
  • Platform Tech
  • /
  • NEW!! - Candle Aggregation indicator
  • Reply to Thread
    • Page 1 23 4
    • Page 1 23 4
0 traders viewing now
  • More
Top of Page
Forex Factory Blog Updated: Alerting All Members
  • Facebook
  • Twitter
About FF
  • Mission
  • Products
  • User Guide
  • Media Kit
  • Blog
  • Contact
FF Products
  • Forums
  • Trades
  • Calendar
  • News
  • Market
  • Brokers
  • Trade Explorer
FF Website
  • Homepage
  • Search
  • Members
  • Report a Bug
Follow FF
  • Facebook
  • Twitter

FF Sister Sites:

  • Metals Mine
  • Energy EXCH
  • Crypto Craft

Forex Factory® is a brand of Fair Economy, Inc.

Terms of Service / ©2022