Interesting post Max:
D chart suggests descending triangle( May 25 to present).
STO going up & RSI >50.
I still sense risk-aversion(not scientific, I know) & await comm$ to collapse.
See what Sunday brings & on 4H or H tf's -do some sells as a result of your input ( ).
).
Appreciate your time to post.

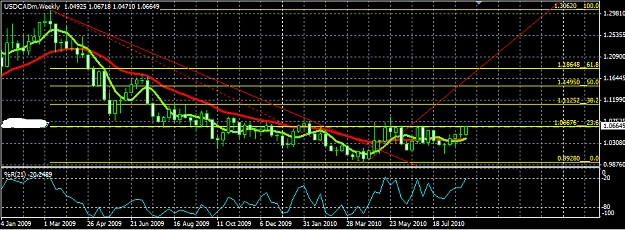
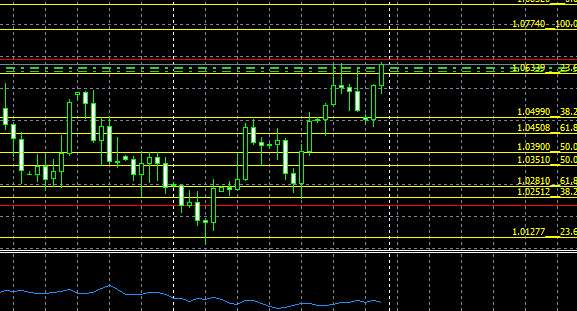
D chart suggests descending triangle( May 25 to present).
STO going up & RSI >50.
I still sense risk-aversion(not scientific, I know) & await comm$ to collapse.
See what Sunday brings & on 4H or H tf's -do some sells as a result of your input (
Appreciate your time to post.