Disliked
This is realy realy hard to say, because pattern appears only at one data feed, different broker does not show this pattern.
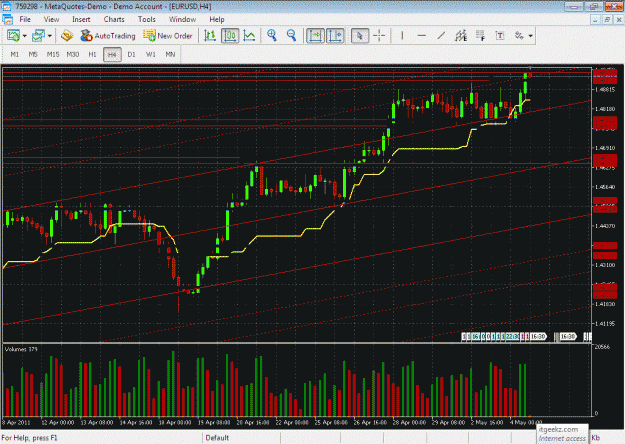
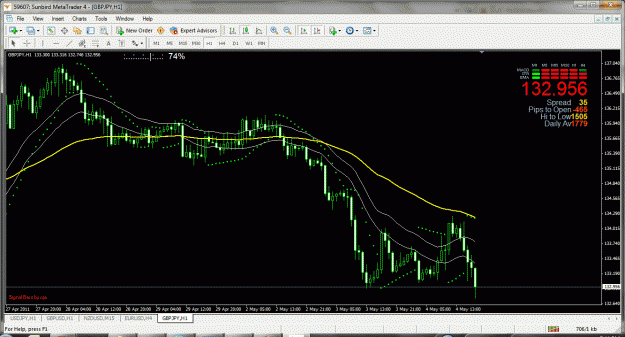
What I show here in the chart is a doji line pattern. It is a row of 2 or more doji candles or candles with small body. Explanation is highly indicison for bears and bulls. Sounds simple, but I have only read in one book for that pattern years ago, and I only have seen it one time. This was in June 2007, where for weekly geppy appeared a doji line pattern, which was followed by an upthrust, and a large sell...Ignored
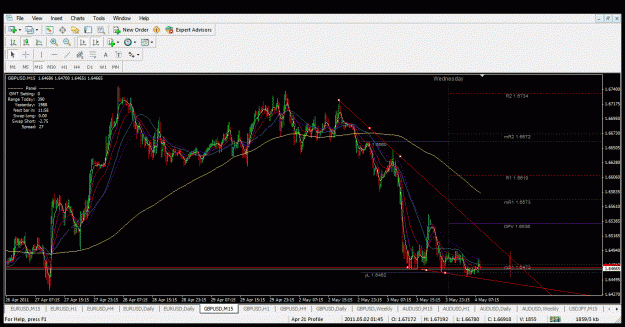
I thought gbp/usd will come down to atleast 1.6388. You think it will go up after 1.6428?