• Home
  • Forums
  • Trades
  • News
  • Calendar
  • Market
  • Brokers
  • Login
  • Join
  • User/Email: Password:
  • 11:53pm
Menu
  • Forums
  • Trades
  • News
  • Calendar
  • Market
  • Brokers
  • Login
  • Join
  • 11:53pm
Sister Sites
  • Metals Mine
  • Energy EXCH
  • Crypto Craft

Options

Bookmark Thread

First Page First Unread Last Page Last Post

Printable Version

Similar Threads

How to flow with the order flow? 23 replies

Cluster Average doesn't update on chart 0 replies

Mental stops vs hard stops 1 reply

365 Trade: Finding the Flow 11 replies

I am looking for EA to put Buy Stops, Buy limits, Sell limits, and Sell Stops. I will 0 replies

  • Trading Discussion
  • /
  • Reply to Thread
  • Subscribe
  • 64
Attachments: Order Flow - Finding cluster of stops on chart
Exit Attachments

Order Flow - Finding cluster of stops on chart

  • Last Post
  •  
  • 1 910Page 111213 25
  • 1 10Page 1112 25
  •  
  • Post #201
  • Quote
  • Jan 19, 2011 3:12pm Jan 19, 2011 3:12pm
  •  Carnegie
  • Joined Feb 2010 | Status: Started when I was 18.. Now 19 | 425 Posts
Well isn't this quite embarassing.

It seems to me as if I am the threadstarter, and I am the one who right now knows/UNDERSTANDS the least of all of you.

SMJones you have pointed out to me what (I don't know what a stop hunt really looks like because I don't believe in my ability to find a stop hunt) a liquidity disequilibrium looks like, if that is what that USDCHF picture is?
Then this gives me an idea of what I should look for.. First I was thinking along the lines that I would see stop hunting(and liquidity disequilibrium) with candlesticks, then I thought it was an area.. Now it seems like it is a little bit of both.

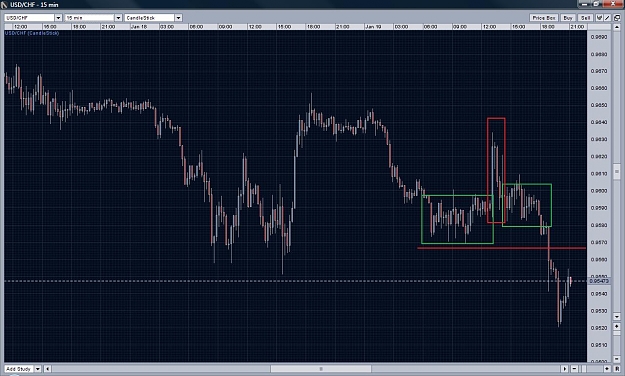
I have attached your picture there once again jones and this is my take on it. I assume this is not a stop-hunt but rather a liquidity disequilibrium. (If it was a stop-hunt then please explain to me, where would these stops be? This doesn't seem like an obvious place for stops..)

Now I don't understand much of liquidity and equilibirum/balance YET, but I am reading more and more.
Anyway, this is how I see it and PLEASE explain to me if I am really wrong now.

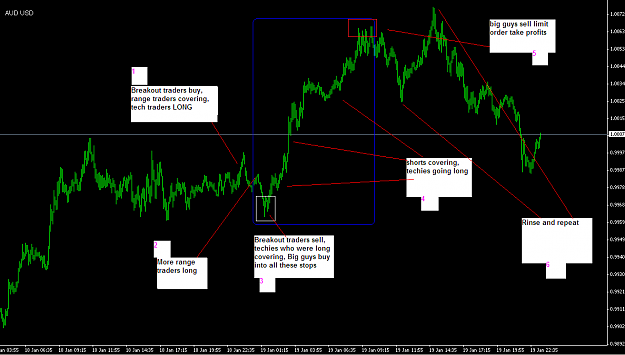
In the green box we had an equilibirum or balance where the price was trading sideways because traders agreed upon the value/price. Then someone decided that it dollars was worth more he/she traded it UP and this spike was caused due to disequilibirum? = Much more bidders than sellers. Now after this there was a balance in price again but it broke down and I have a read line there of where I believe the stops should be.. Since price moved down like that there I am certain that there wasn't any balance (that's why it trended down).

But I am 100% sure I am missing some large parts here in my thinking. Why did it move down sharp instead of staying in a consolidation like before the sharp move up? Did the guy who bought have to sell his position causing this sharp move down?
Attached Image (click to enlarge)
Click to Enlarge

Name: smj.jpg
Size: 166 KB
  • Post #202
  • Quote
  • Jan 19, 2011 3:13pm Jan 19, 2011 3:13pm
  •  triger88990
  • Joined May 2009 | Status: LIFE ITSELF | 1,058 Posts
Quoting Scotty B
Disliked
I'd say that is certainly one aspect of it. This has a lot to do with the mechanics behind pin bar situations as opposed to clean trending markets. Basically, is there real time support or resistance behind a move or does the move fall on it's face? A strongly trending market (sharp slope) with small pullbacks indicate a strong bid re-population, while a strong move that collapses on itself shows no professional interest. Large traders have to average in anyways, so if values are shifting, the pros will have robots that quickly enter bids or asks...
Ignored

The theory is good but you must be able to identified them as they develop in real time. This kind of action can be seen more clearly on 1h and 4h TF even daily chart when they are prone to manipulation to some degree.

The pullbacks into those sharp moves will show you where the average price of market makers truly is, it will make a base, but if you have experience timing down that base is easy, you can catch the bottom without any kind of risk, when price comes back into that zone you will find there the true liquidity.

You must take in consideration the volitility factor in its trend and the time it consumes in it push,you can determine all this from bare chart

The trick is to make the difference between when is a true interest and where is a false movement.You can capitalized on both action if you can spot them, you can go with the momentum or fade when there is no interes, even befor the move is unfold.

Another important thing is where price is heading into, and to know where is the line of least resistence.

Hope I made myself understable, don't know how could I say it differently.

all the best!
1
  • Post #203
  • Quote
  • Jan 19, 2011 3:22pm Jan 19, 2011 3:22pm
  •  triger88990
  • Joined May 2009 | Status: LIFE ITSELF | 1,058 Posts
Quoting Carnegie
Disliked
Well isn't this quite embarassing.

It seems to me as if I am the threadstarter, and I am the one who right now knows/UNDERSTANDS the least of all of you.

SMJones you have pointed out to me what (I don't know what a stop hunt really looks like because I don't believe in my ability to find a stop hunt) a liquidity disequilibrium looks like, if that is what that USDCHF picture is?
Then this gives me an idea of what I should look for.. First I was thinking along the lines that I would see stop hunting(and liquidity disequilibrium) with candlesticks,...
Ignored

just try to take in consideration the price structure to the left. it has his own story of whats happening into the NOW.

all the best!
  • Post #204
  • Quote
  • Jan 19, 2011 3:36pm Jan 19, 2011 3:36pm
  •  deanz
  • Joined Nov 2005 | Status: Member | 113 Posts
Quoting triger88990
Disliked

Hope I made myself understable, don't know how could I say it differently.
Ignored
I would find a chart example helpful if you don't mind.

.
perception is reality
  • Post #205
  • Quote
  • Jan 19, 2011 4:34pm Jan 19, 2011 4:34pm
  •  Bleek
  • Joined Aug 2009 | Status: All your stops are belong to us | 770 Posts
I've not had a chance to read this entire thread, just the first two pages so forgive me if you've already established everything I'm about to say!

My interpretation of order flow is very simple; it's defined by the market liquidity.

This is described on a chart as a trend in a range and consolidation in a range or: range, to trend, to range.

Rinse and repeat.

Trend is defined by the move long or short out of the previous range; the time frame is irrelevant.

Ranges are often drawn on charts as trendlines (diagonals) or S/R (horizontals), ranges can form inside other ranges and 'break-out' to fill the upper and lower scale of the outer range. Typically when breaking long the former range now becomes support and when breaking lower the range now becomes resistance.

Ranges should not be confused with consolidation; consolidation in my mind is liquidity 'balance' where price condenses (this can be as small as 10 pips or larger than 100) along the horizontal with an upper and lower limit defined by pivots - the classic 'rectangle' price action.

How to trade liquidity varies wildly on your money management, risk/reward levels and preferred time frame.
"I made all my money by selling too soon"
  • Post #206
  • Quote
  • Jan 19, 2011 4:40pm Jan 19, 2011 4:40pm
  •  Bleek
  • Joined Aug 2009 | Status: All your stops are belong to us | 770 Posts
Quoting Bleek
Disliked
Ranges should not be confused with consolidation; consolidation in my mind is liquidity 'balance' where price condenses ...
Ignored
I should qualify that, by balance I don't mean on a knife-edge, I mean buyers and sellers fulfilling each others orders in a set scale of price, like a game of tennis bouncing price off each other until finally one side overpowers the other through excess liquidity.
"I made all my money by selling too soon"
  • Post #207
  • Quote
  • Jan 19, 2011 5:16pm Jan 19, 2011 5:16pm
  •  UnnamedPlayr
  • Joined Aug 2010 | Status: Game on: Buy low sell high. | 238 Posts
A real hunt from today with stop liquidation:
Initiative move began with block orders backed up with hidden liquidity on the passive side:


http://img12.imageshack.us/img12/6966/stophunt.png

http://img12.imageshack.us/f/stophunt.png/
How, when and why was it a stop hunting move instead of a regular up move.
Now it's your turn to find out.
  • Post #208
  • Quote
  • Jan 19, 2011 5:30pm Jan 19, 2011 5:30pm
  •  Carnegie
  • Joined Feb 2010 | Status: Started when I was 18.. Now 19 | 425 Posts
Quoting UnnamedPlayr
Disliked
A real hunt from today with stop liquidation:
Initiative move began with block orders backed up with hidden liquidity on the passive side
How, when and why was it a stop hunting move instead of a regular up move.
Now it's your turn to find out.
Ignored

Hey unnamed, you always come with great stuff!

Hmm I have no real idea, maybe som were short with Stop-losses above parity number.. So those who were long could liquidate their inventory to the traders with the stop-losses?

But I need to more time to think.. I will think about this one.

Thanks!
  • Post #209
  • Quote
  • Jan 19, 2011 6:00pm Jan 19, 2011 6:00pm
  •  Benevolent
  • Joined Mar 2010 | Status: Member | 173 Posts
Quoting UnnamedPlayr
Disliked
A real hunt from today with stop liquidation:
Initiative move began with block orders backed up with hidden liquidity on the passive side:


http://img12.imageshack.us/img12/6966/stophunt.png

http://img12.imageshack.us/f/stophunt.png/
How, when and why was it a stop hunting move instead of a regular up move.
Now it's your turn to find out.
Ignored

Was in this today...still holding. Perfect example of the vacuum concept some individuals are talking about. Part of me hopes the cat stays in the bag here guys...
  • Post #210
  • Quote
  • Jan 19, 2011 7:22pm Jan 19, 2011 7:22pm
  •  scott89
  • | Joined Feb 2010 | Status: Member | 113 Posts
The stop-hunt is the one in the white rectangle or the one in the red rectangle?

Just to get on what it looks like on a chart...
Attached Image (click to enlarge)
Click to Enlarge

Name: stophunt.png
Size: 25 KB
  • Post #211
  • Quote
  • Edited at 7:44pm Jan 19, 2011 7:28pm | Edited at 7:44pm
  •  Carnegie
  • Joined Feb 2010 | Status: Started when I was 18.. Now 19 | 425 Posts
SMJones post was quite illuminating now that I understand.

I have attached yet another picture, and if jones picture was to describe inefficiency.. then I have found another one that was 5 hours later

If you look at the USDCHF 5 min chart you will see that the moves look more or less like eachother but reversed:

The first one with the big yellow box spiked up and fell down right where it came from, and I would short on the red line.

The second box basically spikes down and retraces fully and I would have bought at the green line.
Is this what these efficiencies look like?

I have drawn a picture in paint. It appears to me as if inefficiencies look this way, the market moves sideways (or has an agreed value) and then it spikes causing imbalance and if someone fades it then it will most likely move up (in this case). But it cannot be this simple.. impossible

Quoting Trading & Exchanges page 79
Disliked
Stop orders accelerate price changes. Price often changes because traders on one side of the market demand more liquidity than is available. When these price changes activate stop orders, the stop orders unfortunately contribute to the one-sided demand for liquidity. Stop orders accelerate price changes by adding buying pressure when prices are rising and selling pressure when prices are falling. They demand liquidity when it is least available.
Ttraders say that stop order add momentum to the market
Ignored
My question here is really.. WHY ARE WE FADING IT? Why not let the price cascade to next area of liqudity? Isn't that also stop-hunting?
Attached Image (click to enlarge)
Click to Enlarge

Name: inefficiency2.jpg
Size: 160 KB
Attached Image
  • Post #212
  • Quote
  • Jan 19, 2011 8:09pm Jan 19, 2011 8:09pm
  •  havaiana
  • | Joined Aug 2009 | Status: Member | 306 Posts
Quoting scott89
Disliked
The stop-hunt is the one in the white rectangle or the one in the red rectangle?

Just to get on what it looks like on a chart...
Ignored
Maybe i'm wrong (someone please correct me if i am), but this is how i read it
Attached Image (click to enlarge)
Click to Enlarge

Name: untitled.PNG
Size: 42 KB
  • Post #213
  • Quote
  • Jan 19, 2011 8:22pm Jan 19, 2011 8:22pm
  •  Marv
  • | Membership Revoked | Joined Jun 2010 | 1,246 Posts
Quoting havaiana
Disliked
Maybe i'm wrong (someone please correct me if i am), but this is how i read it
Ignored
There is never one "correct" reading. It's all speculation in the end, it's all probabilities.
  • Post #214
  • Quote
  • Jan 19, 2011 8:48pm Jan 19, 2011 8:48pm
  •  scott89
  • | Joined Feb 2010 | Status: Member | 113 Posts
I feel like we are close, expecially you, Carnegie.
I can almost hear the 'gears' in your head working hard while I imagine all the thinking process you go through.

I spent the last 2 days reading through all Darkstar's 1000+ post and I can feel that with his gold nuggets, this and other 1 or 2 threads I made thousands of steps ahead.

I feel like I passed the stage where you think indicators and such stuff is useless... but sometimes you still feel like trying them out, going in the "Strategy" forum etc.

I wanted to thank everyone, not only people like Darkstar or UnnamedPlayr that are trying to help us guiding our path, but I wanted to thank people like Carnegie, Scotty_B, smjones and many others who contributed in this and other threads.
The biggest thanks, anyway, goes to a friend of mine who opened my eyes telling me about "orderflow", a word that I had never heard before he told me.

I wanted to thank you, because you are ruining my University studies for this xD
I SHOULD BE STUDYING NOW and I'm here going through 100s of mental processes, trying to crack it, because I fell that if I can't do it now, I won't be doing it for a long time.

I'll stop thinking for today, I need to switch my brain off and take a nice sleep. As always I promise to myself that tomorrow I'll study for my University exams, but I know the first thing I'll do is turning my laptop on to check this thread.

Bye for now, and thank you all.
  • Post #215
  • Quote
  • Jan 19, 2011 8:54pm Jan 19, 2011 8:54pm
  •  FXSurfer
  • Joined Mar 2007 | Status: ~~~~~~~~~ | 3,692 Posts
Quoting scott89
Disliked
I wanted to thank you, because you are ruining my University studies for this
Ignored
Ha!
  • Post #216
  • Quote
  • Jan 19, 2011 10:19pm Jan 19, 2011 10:19pm
  •  deanz
  • Joined Nov 2005 | Status: Member | 113 Posts
Quoting UnnamedPlayr
Disliked
http://img12.imageshack.us/img12/6966/stophunt.png
Ignored
I would like to submit an alternative view as to why price returned below the breakout, someone with deep pockets has been passively and actively buying for many days, if they can afford this then they probably have no need for placing stops, therefore there are more stop orders connected to short orders in the market. Ever noticed more stops consistently triggered in one direction more than the other ?

So when price breaks resistance the stops start to cascade/domino. Now the Deep Pockets can either do nothing, in which case price will shoot up leaving long candles with high volume but you might be able to notice they are actually not very high volume per each pip of movement.

Or they can control the cascade/domino effect, by either dumping some longs, which is counter productive to their long accumulation, or they could enter new short positions. Both these examples might be seen by similar volume candles to a "do nothing" scenario but they are much shorter in height, so with a high volume to pip ratio, and to profit from these shorts they need to drive price back down below the initial breakout.

.
perception is reality
  • Post #217
  • Quote
  • Jan 20, 2011 12:17am Jan 20, 2011 12:17am
  •  Scotty B
  • Joined Dec 2007 | Status: Informed | 1,636 Posts
Quoting smjones
Disliked
Yes, this makes sense to me. If this is one aspect of it, do you think there is a way for the disequilibrium to be identified on a chart and be able to separate it from a lack of professional interest? Or, is there any need to separate it as they both seem to cause the same effect on small time scales.

There seems to be an aspect that has not been discussed much and that is the Option barriers that I see all the time on Thompson and have piggy backed trades to to them, with very good success. Could this be a form of that latent liquidity?
Ignored
No, I don't think you can differentiate between a move that will experiance negative feedback (be reversed) with only a chart, I could be wrong. Because fundamental information is so asymmetric, it would be impossible to know who is really making a move happen unless you had actual order information (time and sales), or you knew for example that a barrier was being knocked out.

The knocking out of a barrier, when values have not changed creates a stochastic effect in the market. The market is incentivized to make a round trip. Those who are hunting the barrier will be after the depth that the barrier defenders create with their stops, and value traders are incentived to fade the move entirely. Now that these option defense plays are becoming common knowledge for retail traders, I'm sure they are stale news in the bigger picture. I'd imagine that the competition to get filled by those stops is pretty fierce and that only a few participants actually get the benefit. For example, if you are Joe Schmoe at hedgefund X and you get word of a barrier at 1.2300, and you are the first to hear about it, you're going to most likely enter pending orders in the book between 1.2290-1.2305ish, and should the barrier be knocked out and defended, you'll be one of the first to be filled by the stops. By the time we hear about it, it's sort of a done deal. As small retail traders, we sort of take liquidity for granted, we are not trading the option defense play for liquidity's sake. So, by the time the move happens, you will have value traders averaging in through the move, you'll have traders who don't get filled by the stops who are then incentivized to submit market orders after the barrier is knocked out, and a thin book behind the whole move that will create a pin bar and retail trader John's chart.

I'd expect a swift move to 50% of the move where many of the value trader's will begin entering profit at their average price and where many of them will have their bids to net out of their positions at a profit. The stoplosses of those who bought the breakout will help fill the value traders bids along with the sales of everyone who was originally buying towards the barrier. I hope I'm making sense here.

Now, imagine a move where fundamental values truly have shifted (higher for example). You ussually see long bars with tiny retracements i.e. there is no negative feedback trading. This is because of all the bids propping up the market, along with a lack of professional profit taking. The implication is that value is higher, until the pattern breaks. Once the market hits a prolonged period of hawking sideways, you know the pros are averaging out and that we are near value.
  • Post #218
  • Quote
  • Jan 20, 2011 1:56am Jan 20, 2011 1:56am
  •  Benevolent
  • Joined Mar 2010 | Status: Member | 173 Posts
For those of you interested, the AU will be having the same vacuum type scenario for a long.
  • Post #219
  • Quote
  • Jan 20, 2011 2:15am Jan 20, 2011 2:15am
  •  triger88990
  • Joined May 2009 | Status: LIFE ITSELF | 1,058 Posts
Quoting Benevolent
Disliked
For those of you interested, the AU will be having the same vacuum type scenario for a long.
Ignored
as far as I can see and my understanding goes I see no such action developing.

Or maybe you should point out the implication of such a developing in relationship with the TF, and if affects only the short term move.

all the best!
  • Post #220
  • Quote
  • Jan 20, 2011 2:39am Jan 20, 2011 2:39am
  •  Benevolent
  • Joined Mar 2010 | Status: Member | 173 Posts
Quoting triger88990
Disliked
as far as I can see and my understanding goes I see no such action developing.

Or maybe you should point out the implication of such a developing in relationship with the TF, and if affects only the short term move.

all the best!
Ignored
It's a combination of tape reading, fundies, a reliable data vendor(Just as Scotty has mentioned) and a few other nick-nacks. This is only my perception of liquidity traps, however.

Best to you.

P.S. This trade was analyzed from the 4 hour to 15 minute. I'm looking for a 1-2 day hold, I enjoy when interest rate differentials are in my favor as well. Just a personal preference I suppose(Thanks Dom ).
  • Trading Discussion
  • /
  • Order Flow - Finding cluster of stops on chart
  • Reply to Thread
    • 1 910Page 111213 25
    • 1 10Page 1112 25
0 traders viewing now
  • More
Top of Page
  • Facebook
  • Twitter
About FF
  • Mission
  • Products
  • User Guide
  • Media Kit
  • Blog
  • Contact
FF Products
  • Forums
  • Trades
  • Calendar
  • News
  • Market
  • Brokers
  • Trade Explorer
FF Website
  • Homepage
  • Search
  • Members
  • Report a Bug
Follow FF
  • Facebook
  • Twitter

FF Sister Sites:

  • Metals Mine
  • Energy EXCH
  • Crypto Craft

Forex Factory® is a brand of Fair Economy, Inc.

Terms of Service / ©2021