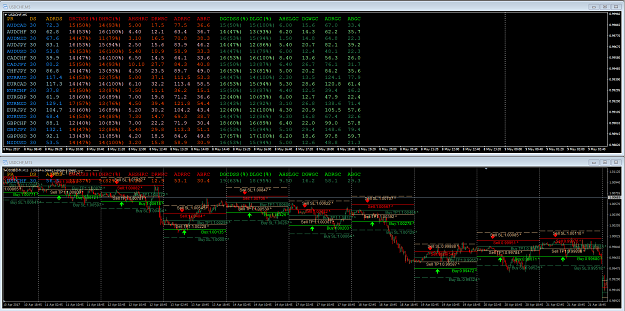
This tool will provide you the average daily range statistics over a given sample period.
Here's what the data provides:
-Over a given sample period what the ADR was for both up & down days
-It counts the number of down days (red candle) & the number of up days (green candle) from the sample period
-It counts the number of times the high is set 1st on a down day (red candle)
-It provides the number of average hours it takes to set the high on a down day (red candle)
-It provides the average upper wick values & candle bodies for a down day (red candle)
-It provides the ADR for the down days (red candle) over the sample period
-It counts the number of times the low is set 1st on an up day (green candle)
-It provides the number of average hours it takes to set the low on an up day (green candle)
-It provides the average lower wick values & candle bodies for an up day (green candle)
-It provides the ADR for the up days (green candle) over the sample period
-It has an optional buy level with stop loss & take profit target based of the average wick values
-It has an optional sell level with stop loss & take profit target based of the average wick values
-It has an optional dashboard view for up to 23 currency pairs
I want to say a special "thank you" to my programmer here on FF. He has worked very hard with me to make this into a very unique tool.
The indicator cost $50. Will accept payment in bitcoin. Just post or send me a PM.
Attached Image (click to enlarge)