I'm seeking an indicator that I used to have that once you input 2 price levels, the indicator will draw them and highlight the area in between.
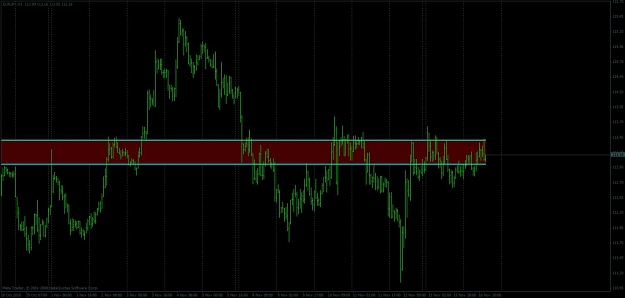
Example: Like between price 1.6000 and 1.6025 .... there is a line drawn at both levels and the area in between the prices is highlighted. Can choose line and highlight color.
----------------- 1.6025 (line drawn)
//////////////////
////////////////// (highlighted area)
//////////////////
----------------- 1.6000 (line drawn)
I used it to draw my support resistance areas.
Anybody have such an indicator ?