Hello,
This thread is started because I need some feedback in my research. Maybe it is completely wrong, or stupid or anything - I don't know. All I know is that I did a little research on it and I need some kind of feedback.
The idea behind my research was this:
Divergence with MACD/RSI is pretty powerful and many people use it.
I am a naked trader (no PM's please I already have a girlfriend) and I believe in the concept that indicators only indicate and it is the Price Action that shows the direction to the indicators.
That said, should mean that divergence is occuring IN the price action, so the indicator really isn't needed to be plotted on the chart?
What divergence does is plot MOMENTUM in the movement. Basically it works like this: the price makes a higher high and the MACD does NOT make a higher high meaning that the momentum behind the move is drying up.
My research looked something like this:
If the market moves up (1) and then retraces/corrects (2) and then move up again (3):
if the up-move after retracement isn't very strong, it is a divergence.
What do I mean by 'up-move isn't very strong'?
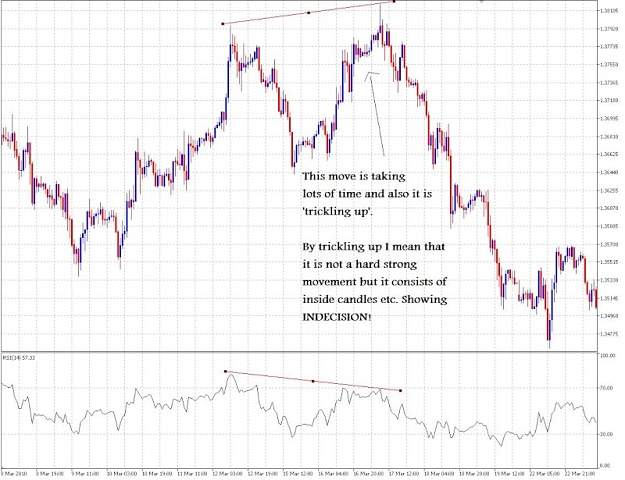
Basically, that means that the third wave/leg constitutes of reversal candles. (I.e spinning tops, inside candles, pinbars, leaving long tails etc.. Look at the picture). The market is "trickling up" and not a hard, strong move.
Also, if the third leg move up takes allot of time. That also will indicate lack of momentum..

The test was like this:
First: test these rules on a consolidating market 50 times. Calculate how many times it worked/didn't work out.
Second: test these rules on a trending market 50 times. Calculate how many tiems it worked/didn't work out.
So, let's see what the research told us:
Consolidating market:
Worked: 41
Didn't work: 9
Trending market:
Worked: 27
Didn't work: 23
So in a consolidating market it has a working ratio of: 82% and in a trending market the ratio is 54%.
This gives us a clear picture: there is a bigger chance of the market turning on these types of market situations (instability) in a consolidating market than in a trending.
Also, one other thing I noticed is that the times when this worked out in the trending market was when it went INTO a consolidating market.
By that I mean that the market was trending down(or up) and then made a divergence, so it went into a trending market..
Ok so here is a picture of the research in real charts.
You see that the market makes a higher high but the RSI is making a lower high = running out of steam.
What I mean by my research principles: 'trckling up' is what you see on the chart. The market makes a retracement of the first strong move and then makes another leg up.
However, this second leg up has many inside candles, many candles with long wicks, many spinning tops and rounds it all up with a nice pinbar with the lovely pullback.
What I intend to show here is that there is no need for the indicator, the price chart shows this itself with the movement in TIME and also in PRICE (the bars).
I'm just looking for feedback here or maybe new info of some kind that can help me understand PA a little more.
Hopefully someone can help!
Thank you for taking time.
This thread is started because I need some feedback in my research. Maybe it is completely wrong, or stupid or anything - I don't know. All I know is that I did a little research on it and I need some kind of feedback.
The idea behind my research was this:
Divergence with MACD/RSI is pretty powerful and many people use it.
I am a naked trader (no PM's please I already have a girlfriend) and I believe in the concept that indicators only indicate and it is the Price Action that shows the direction to the indicators.
That said, should mean that divergence is occuring IN the price action, so the indicator really isn't needed to be plotted on the chart?
What divergence does is plot MOMENTUM in the movement. Basically it works like this: the price makes a higher high and the MACD does NOT make a higher high meaning that the momentum behind the move is drying up.
My research looked something like this:
If the market moves up (1) and then retraces/corrects (2) and then move up again (3):
if the up-move after retracement isn't very strong, it is a divergence.
What do I mean by 'up-move isn't very strong'?
Basically, that means that the third wave/leg constitutes of reversal candles. (I.e spinning tops, inside candles, pinbars, leaving long tails etc.. Look at the picture). The market is "trickling up" and not a hard, strong move.
Also, if the third leg move up takes allot of time. That also will indicate lack of momentum..
Attached Image
The test was like this:
First: test these rules on a consolidating market 50 times. Calculate how many times it worked/didn't work out.
Second: test these rules on a trending market 50 times. Calculate how many tiems it worked/didn't work out.
So, let's see what the research told us:
Consolidating market:
Worked: 41
Didn't work: 9
Trending market:
Worked: 27
Didn't work: 23
So in a consolidating market it has a working ratio of: 82% and in a trending market the ratio is 54%.
This gives us a clear picture: there is a bigger chance of the market turning on these types of market situations (instability) in a consolidating market than in a trending.
Also, one other thing I noticed is that the times when this worked out in the trending market was when it went INTO a consolidating market.
By that I mean that the market was trending down(or up) and then made a divergence, so it went into a trending market..
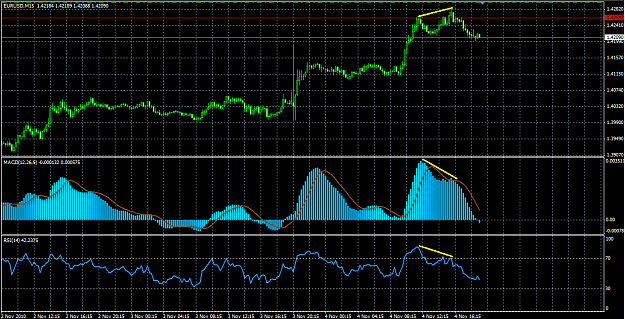
Ok so here is a picture of the research in real charts.
You see that the market makes a higher high but the RSI is making a lower high = running out of steam.
What I mean by my research principles: 'trckling up' is what you see on the chart. The market makes a retracement of the first strong move and then makes another leg up.
However, this second leg up has many inside candles, many candles with long wicks, many spinning tops and rounds it all up with a nice pinbar with the lovely pullback.
What I intend to show here is that there is no need for the indicator, the price chart shows this itself with the movement in TIME and also in PRICE (the bars).
Attached Image (click to enlarge)
I'm just looking for feedback here or maybe new info of some kind that can help me understand PA a little more.
Hopefully someone can help!
Thank you for taking time.