This here strategy goes as follows.
Every close of the 5m a check is done.
- when the price is above the pivot AND above the 200 EMA, we buy.
- when the price is below the pivot AND below the 200 EMA, we sell.
- otherwise the position we have is closed.
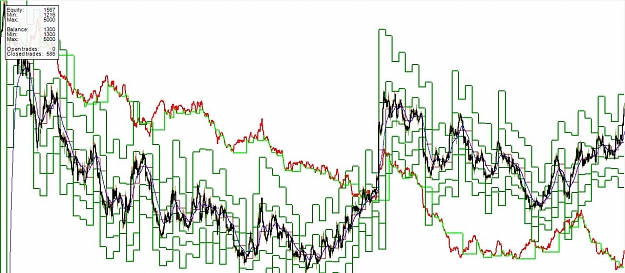
Now the Red line is the equity and the green line is the balance.
The simulation is done over a period of 3 months.
On first sight this looks bad.. the green line goes down.
But, looking closer... the red equity line is almost always above the green line. The position almost always sold to far on its way down.
So if i change the TP strategy this might be profitable.
Every close of the 5m a check is done.
- when the price is above the pivot AND above the 200 EMA, we buy.
- when the price is below the pivot AND below the 200 EMA, we sell.
- otherwise the position we have is closed.
Now the Red line is the equity and the green line is the balance.
The simulation is done over a period of 3 months.
On first sight this looks bad.. the green line goes down.
But, looking closer... the red equity line is almost always above the green line. The position almost always sold to far on its way down.
So if i change the TP strategy this might be profitable.
Attached Image (click to enlarge)