H guys I have been a lurker on this forum for a number of years and would like to share a system that I have developed using another similar system that I found on the internet
This is a mechanical system which involves an entry at 5.00 am gmt + or - 40 pips
I have tried it out on the euro /yen and as quite a good success rate
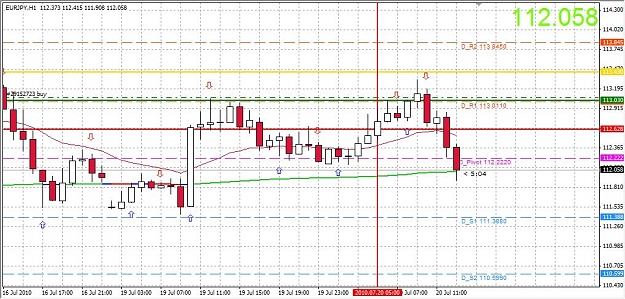
Initially plot a 200 ema on a 1hr chart.
At the mid point of the5 00am GMT candle draw a horizontal line mark it as X (mid point of candle not including the wicks)
If the candle is below the 200 ema draw a horizontal line 40 pips below and another horizontal line 40 pips below that line.
If the candle is above the 200 ema then draw a horizontal line 40pips above and another above that horizontal line 40 pips
If the 5.00 am candle is within 10 pips of the 200ema, draw these lines above and below the line 200 ema line
Trading strategy
If the 5.00 am candle is below the 200 ema sell 2 mini lots at 40 pips below the X horizontal line
If the 5,00 am candle is above the 200 ema buy 2 mini lots at 40 pips above the X horizontal line
On the X Line buy 2 mini lots at 40 pips above and sell 40 pips below
Stop loss is 80 pips with both lots
Close 1st lot at 40 and 2nd lot use a trailing stop of 40 pips so when first one is in profit the 2nd lot will be at break even
Close 1st lot at midnight and let the 2nd lot run until stopped out
Possible loss 160 pips
Possible win 40 pips with 1st lot 2nd lot anything from 0 to whatever
I have checked on the last 7 months and this system is profitable
********* 1st lot ,,,, ,,,,,, 2nd lot with trailing stop ,,,,,,,,,, Total /month
November ,,,,,,,,, 240 200 440
December .,,,,,,,, 270 230500
January ,,,,,,,,,, 140 220 360
February ,,,,,,,,, 20 450470
March ,,,,,,,, 160 200 360
April ,,,,,,,,,, -65 -50 Minus 115
May ,,,,,,,,,,,440 5701010
June ,,,,,,,,,, 320 190 510
Using a bank of $1000 total profit 8 months 2535
I have been quite conservative in my calculations and only a rough estimation is used for trailing stop .
I haven’t calculated spread into this but if with an average of 12 trades a month per lot that would be equal to 72 pips *8 =576 Equals 2535-576 1959 pips
I would appreciate if any one could check the system over a extended period
and maybe create an ea to backtest properly
July is running at a loss of 133 pips at the moment
This is a mechanical system which involves an entry at 5.00 am gmt + or - 40 pips
I have tried it out on the euro /yen and as quite a good success rate
Initially plot a 200 ema on a 1hr chart.
At the mid point of the5 00am GMT candle draw a horizontal line mark it as X (mid point of candle not including the wicks)
If the candle is below the 200 ema draw a horizontal line 40 pips below and another horizontal line 40 pips below that line.
If the candle is above the 200 ema then draw a horizontal line 40pips above and another above that horizontal line 40 pips
If the 5.00 am candle is within 10 pips of the 200ema, draw these lines above and below the line 200 ema line
Trading strategy
If the 5.00 am candle is below the 200 ema sell 2 mini lots at 40 pips below the X horizontal line
If the 5,00 am candle is above the 200 ema buy 2 mini lots at 40 pips above the X horizontal line
On the X Line buy 2 mini lots at 40 pips above and sell 40 pips below
Stop loss is 80 pips with both lots
Close 1st lot at 40 and 2nd lot use a trailing stop of 40 pips so when first one is in profit the 2nd lot will be at break even
Close 1st lot at midnight and let the 2nd lot run until stopped out
Possible loss 160 pips
Possible win 40 pips with 1st lot 2nd lot anything from 0 to whatever
I have checked on the last 7 months and this system is profitable
********* 1st lot ,,,, ,,,,,, 2nd lot with trailing stop ,,,,,,,,,, Total /month
November ,,,,,,,,, 240 200 440
December .,,,,,,,, 270 230500
January ,,,,,,,,,, 140 220 360
February ,,,,,,,,, 20 450470
March ,,,,,,,, 160 200 360
April ,,,,,,,,,, -65 -50 Minus 115
May ,,,,,,,,,,,440 5701010
June ,,,,,,,,,, 320 190 510
Using a bank of $1000 total profit 8 months 2535
I have been quite conservative in my calculations and only a rough estimation is used for trailing stop .
I haven’t calculated spread into this but if with an average of 12 trades a month per lot that would be equal to 72 pips *8 =576 Equals 2535-576 1959 pips
I would appreciate if any one could check the system over a extended period
and maybe create an ea to backtest properly
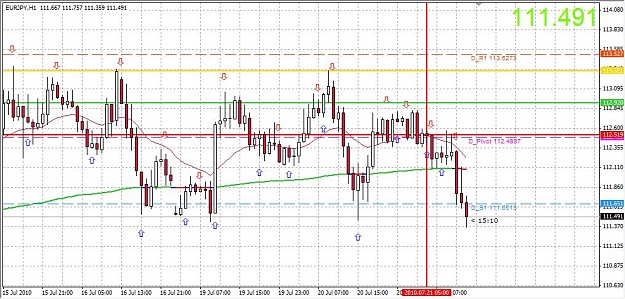
July is running at a loss of 133 pips at the moment
Attached Image (click to enlarge)