i like Dr G's idea of aided VSA - or was that HG's concept? in any case, here's a chart showing some confluence of S/R levels. some levels on daily are easy enough to spot, but when you add Fibo levels and see confluence, i think that just adds weight to those levels. apply VSA principals to those levels and you have excellent trading opportunities.
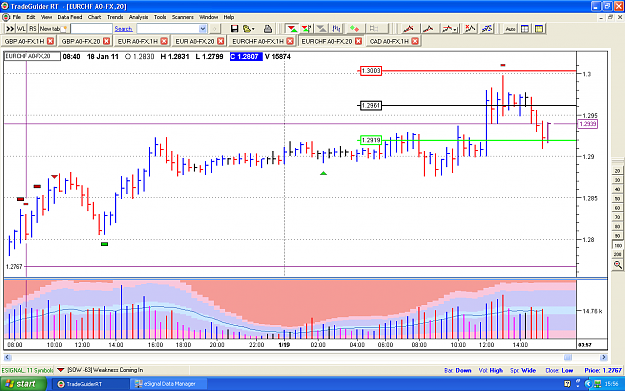
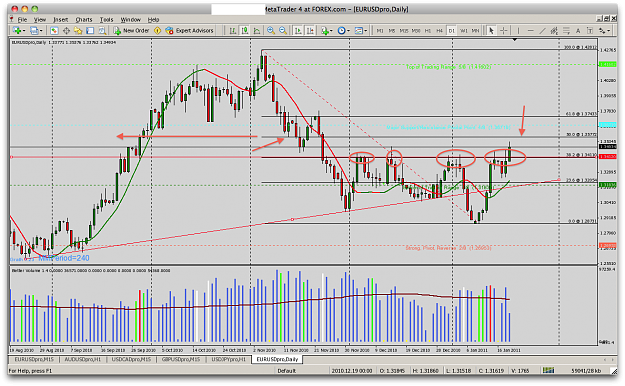
daily chart below. 1.3577 next major resistance level 50% fib as shown, and s/r level from late september, and in november. 1.3412 area as mentioned yesterday is strong s/r as well, 38.2% fibo plus obvious s/r as shown. at some point EU will need to go back to 3412 area to test and reaction there will be key. however i think short term we test 3450-60 area (yesterday's high and today's london low) before moving up to 3577 area. reaction there will dictate if we go back to test 3412 IMO. 3670 is also a MML resistance to watch out for.
Would like feedback. still trying to improve my analysis of S/R levels.
Attached Image (click to enlarge)
Change is the only constant