• Home
  • Forums
  • Trades
  • News
  • Calendar
  • Market
  • Brokers
  • Login
  • Join
  • User/Email: Password:
  • 2:38pm
Menu
  • Forums
  • Trades
  • News
  • Calendar
  • Market
  • Brokers
  • Login
  • Join
  • 2:38pm
Sister Sites
  • Metals Mine
  • Energy EXCH
  • Crypto Craft

Options

Bookmark Thread

First Page First Unread Last Page Last Post

Print Thread

Similar Threads

VSA-divergence trading 187 replies

How to Blow $200 account using VSA--- 594 replies

VSA Journal 57 replies

VSA broker history change datas 11 replies

  • Interactive Trading
  • /
  • Reply to Thread
  • Subscribe
  • 12,005
Attachments: vsa with Malcolm
Exit Attachments

vsa with Malcolm

  • Last Post
  •  
  • 1 17701771Page 177217731774 1784
  • 1 Page 1772 1784
  •  
  • Post #35,421
  • Quote
  • Jan 27, 2022 12:18pm Jan 27, 2022 12:18pm
  •  Anotan
  • Joined Jan 2015 | Status: Member | 1,050 Posts
Quoting Macallik
Disliked
Does anyone have any tips there as well? {image}
Ignored
Something that I wish I had known early on, is that climatic action isn't really that interesting untill the H/L has been taken out. Especially when its soon after the climatic action you see an entire bar outside of the H/L, IMO that's when it gets interesting. Once I see that, then I'll start finding S/R and digging through the PA.
Trading isn't about being right, it's about exploiting your edge.
 
7
  • Post #35,422
  • Quote
  • Jan 28, 2022 12:47am Jan 28, 2022 12:47am
  •  Macallik
  • | Joined Sep 2010 | Status: Member | 120 Posts | Invisible
Thanks to both of you for weighing in!
 
1
  • Post #35,423
  • Quote
  • Feb 1, 2022 1:18pm Feb 1, 2022 1:18pm
  •  trezo
  • Joined Jun 2020 | Status: not millionaire yet | 194 Posts
hello
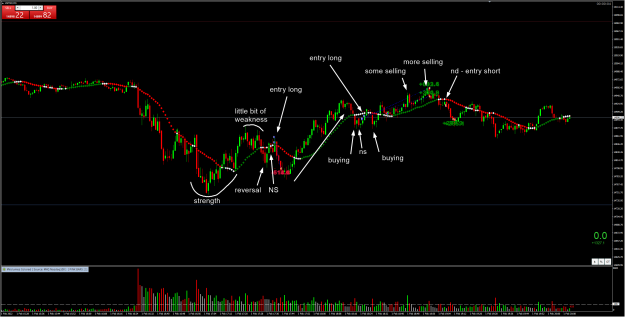
My today trades on NQ.

I think I fucked up with this first long. But I thought this weakness was weak and buyers will win.
You can tell me what should be done diffrent.
Attached Image (click to enlarge)
Click to Enlarge

Name: screenshot.png
Size: 127 KB
Daytrader
 
4
  • Post #35,424
  • Quote
  • Feb 2, 2022 5:04am Feb 2, 2022 5:04am
  •  PranithR
  • Joined Jul 2021 | Status: Learning is never ending journey | 101 Posts
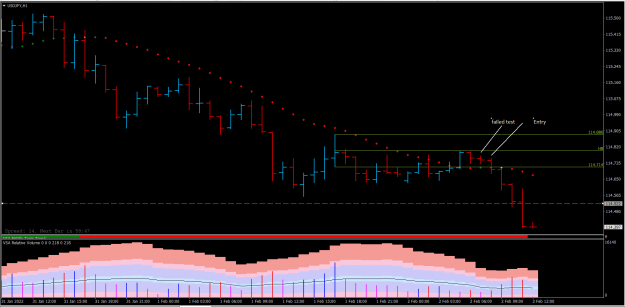
Short on UJ 1hr chart after failed test at yesterdays HB
Attached Image (click to enlarge)
Click to Enlarge

Name: Screenshot (135).png
Size: 36 KB
Learning is a never ending Journey
 
6
  • Post #35,425
  • Quote
  • Feb 2, 2022 6:28pm Feb 2, 2022 6:28pm
  •  SyntaxError
  • | Joined Oct 2020 | Status: Member | 88 Posts
Pranith

Please can you describe for me now you defined that bar on USDJPY as a failed test ?

The definition (SOW 86) calls for I believe a wide spread down bar closing on the lows with the low and close lower than the previous few bars

Not nitpicking I just would like to know your definition so we all learn something from this good shortable set up

Thanks
 
2
  • Post #35,426
  • Quote
  • Feb 2, 2022 6:58pm Feb 2, 2022 6:58pm
  •  Paulscaff1
  • Joined Feb 2021 | Status: Member | 599 Posts
Quoting SyntaxError
Disliked
Pranith Please can you describe for me now you defined that bar on USDJPY as a failed test ? The definition (SOW 86) calls for I believe a wide spread down bar closing on the lows with the low and close lower than the previous few bars Not nitpicking I just would like to know your definition so we all learn something from this good shortable set up Thanks
Ignored
I can see how it looks like a failed test.

I would say that the narrow range bar he marked would be fair to be called a test. Simply because ive seen numerous examples of similair narrow range bars that were defined as tests by guys like Seb Manby, and Gavin Holmes etc.

Then the next bar closed down which changed it to a failed test.

The Sow 86 is from the Tradeguider definition which talks about the failed test bar being part of a pattern sequence.
Bar 1-Test.
Bar 2- Failed test. Praniths entry, (Closed lower than previous few bars)


Thats just my thoughts would be good to hear others opinions, I know Anotan likes a failed test.
 
3
  • Post #35,427
  • Quote
  • Feb 2, 2022 9:36pm Feb 2, 2022 9:36pm
  •  HiddenGap
  • Joined Aug 2009 | Status: Reading the tape | 2,297 Posts
Quoting SyntaxError
Disliked
Pranith Please can you describe for me now you defined that bar on USDJPY as a failed test ? The definition (SOW 86) calls for I believe a wide spread down bar closing on the lows with the low and close lower than the previous few bars Not nitpicking I just would like to know your definition so we all learn something from this good shortable set up Thanks
Ignored
My basic definition of a Test is:

A narrow range DOWN bar that makes a lower low, closes on its middle or high, and has volume less than the previous two intervals. Making a lower low is really important once you understand the effect new highs and new lows have on most market participants.

I does appear this interval makes a lower low, so I would call it at Test. The next bar is DOWN so the Test Failed, giving us a Failed Test. If it does not make a lower low, I would term it No Supply. Since the next bar is DOWN it is a non confirmed No Supply.

But here's the rub: As Gavin has recently stated, all No Supply bars are effectively Test bars. Therefore, if this is a No Supply bar that is unconfirmed, it is also a Test bar that is unconfirmed. And an unconfirmed Test bar is a Failed Test.

But what's more important is that our Hero recognized the following:

1. a DOWN bar on volume less than the previous two shows that the Smart Money is not heavily active (or selling). And if they're not interested in selling, they must be interested in buying.

2. The next bar shouldn't be DOWN if the previous was true. Therefore the market must actually be weak.

3. Couple that with the fact that the trend is DOWN and price is at HB and ......................
The Market is either drawing to liquidity or running to an imbalance.
 
5
  • Post #35,428
  • Quote
  • Feb 2, 2022 10:15pm Feb 2, 2022 10:15pm
  •  SyntaxError
  • | Joined Oct 2020 | Status: Member | 88 Posts
Ahh dissent in the ranks.

HG respectfully I disagree

A Failed Test in the FX world is a rare beast indeed and it is as I suggested a SOW 86

It is a very strong sign of weakness and in the right place can be shorted immediately

Attached NZDJPY is a good example that conforms to Toms VSA rule set as a true Failed Test

This Failed Test that has crept into the lingo on this thread is not a true failed test that you can short with confidence like this example

Testing (SOS) takes many subtle variations and is not a signal to go long or anything like that.

Testing must be read in conjunction with more important SOS signals like Toms Principles and Shakeout bars etc

Just because the SOS test fails does not mean it is a SOS 86 failed test, they are different

Just saying
Attached Image (click to enlarge)
Click to Enlarge

Name: NZDJPY_60_FailedTest.png
Size: 26 KB
 
2
  • Post #35,429
  • Quote
  • Feb 3, 2022 2:47am Feb 3, 2022 2:47am
  •  Paulscaff1
  • Joined Feb 2021 | Status: Member | 599 Posts
Yaas another popcorn moment!

Thanks Syntax for sparking the discussion.

HG, about what you said about the Test/NS thing,

I think it was a Seb Manby video, where he was talking through some bar by bar analysis, he said something like "here we have two test bars"....a member of the audience said " narrow range, isnt that a no supply bar?" The reply was "yes, you could call it a no supply or a test, remember they are both the same thing, they are all variations of a test......dont get too hung up on the actual bar definitions"

Syntax, I hope you dont mind me asking this mate,

I know you put a lot of faith in Tom's setup sequences, but do you actually trade them as a stand alone method in a day to day basis?

Reason I ask is, from what ive seen, most VSA'ers dont seem to use them as a stand alone method, and often seem to incorporate other methods of technical analysis to support the trading decision.

I saw in one video Tom Williams saying that he would go short on the first, Buying Climax-No demand sequence after a long uptrend, and then Todd Krueger saying that he was more conservative and would wait for an upthrust for confirmation.

Both of their entry criteria's seem pretty aggressive and almost "too easy", and I wonder if there is a link to why we dont see many trading this way.

Whats your thoughts mate?
 
1
  • Post #35,430
  • Quote
  • Feb 3, 2022 4:59am Feb 3, 2022 4:59am
  •  bandler
  • Joined Apr 2020 | Status: Member | 59 Posts | Online Now
Just Me keeping things simple, if you have weakness in the background, tests will fail
 
4
  • Post #35,431
  • Quote
  • Feb 3, 2022 8:14am Feb 3, 2022 8:14am
  •  SyntaxError
  • | Joined Oct 2020 | Status: Member | 88 Posts
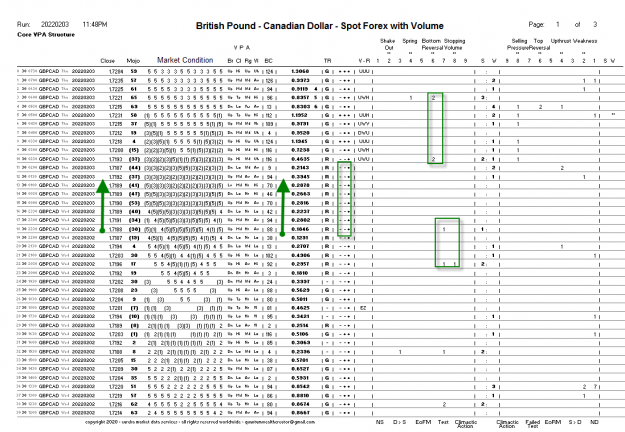
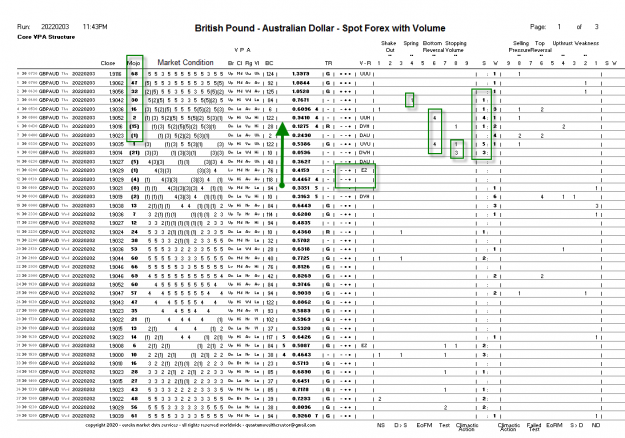
Combination of very powerful (Volume Price Analysis) VPA signals that conform strictly to the Wyckoff and Tom's Rule Sets as published by them with some extra bells and whistles i have added for trade management and a few other nifty tools

Such as we place momentum and energy for each pair, entry points and exit points add the Mojo and VPA exact status (and of course dissecting the currency which drives the whole show)

see ForexEarlyWarning for a simple but powerful methodology that works on Currency trading

The attached is what i call a 7 banger .. they come through about once every trading cycle of 24 hours like clockwork

GBP currency massively set up moves and then it drags its pairs with it long side for Primaries and you short the Inverses (GBPEUR) to produce a very powerful low risk basket trade for all permutations of the GBP

GBPAUD P British Pound - Australian Dollar - Spot Forex with Volume
GBPCAD P British Pound - Canadian Dollar - Spot Forex with Volume
GBPCHF P British Pound - Swiss Franc - Spot Forex with Volume
GBPEUR I British Pound - Euro - Spot Forex with Volume ** Inverse **
GBPJPY P British Pound - Japanese Yen - Spot Forex with Volume
GBPNZD P British Pound - New Zealand Dollar - Spot Forex with Volume
GBPUSD P British Pound - United States Dollar - Spot Forex with Volume

All this is driven off DataBases with alarms and triggers to alert an act.
A visual chart lies behind it but the numbers from the underlying VPA drive the whole thing

28 Pairs
28 Inverses
8 Currencies
64 Tickers per auto cycle of 15 + 30 + 60 + 120 + 240 mins

Works for me I assure you

HTH
Attached Images (click to enlarge)
Click to Enlarge

Name: GBPCAD_60_Breakout.png
Size: 50 KB Click to Enlarge

Name: GBPAUD_60_Breakout.png
Size: 50 KB
 
3
  • Post #35,432
  • Quote
  • Edited at 10:10am Feb 3, 2022 9:03am | Edited at 10:10am
  •  PranithR
  • Joined Jul 2021 | Status: Learning is never ending journey | 101 Posts
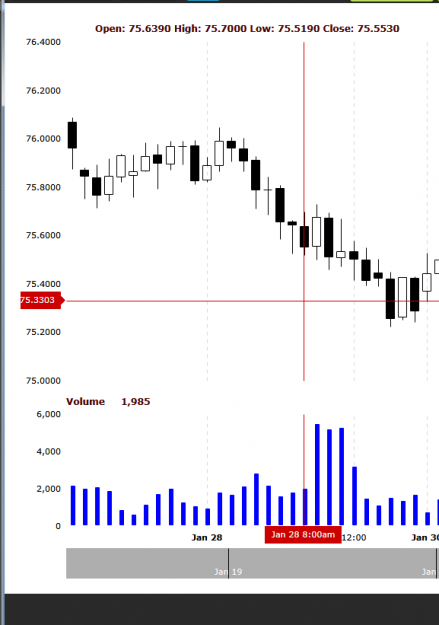
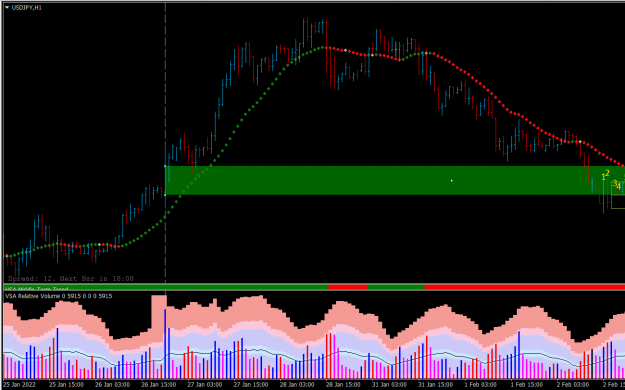
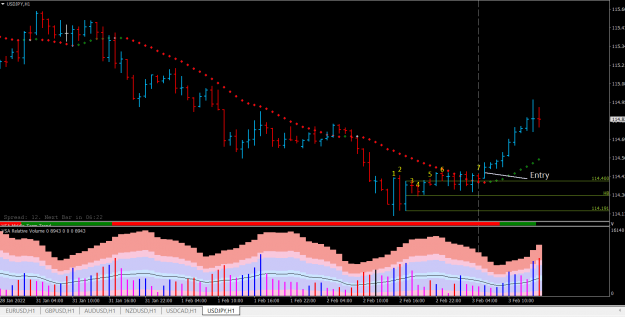
My bias was bearish on UJ for the past few days and got some green pips in short trades, however, to be sudden my bias has changed in yesterday's new york session. Got some green pips on today long also.

Bar 1 - was near 26th January UHV bar + Ultra-wide range ( I remember Hidden Gap showed in some of his posts using Supply and demand delta zones where he marks previous close and next bar close related to current Ultra wide bars, where some business is pending - I think this is what is called "Hidden gap" ),

Bar 1 with average spread, good volume, checking for supply, and closing on the high, after a decent downtrend, There is where I saw some demand pushing price up.

bar 2 is down bar volume is greater than bar 1 but bar 2 low is not lower than bar1, Next bar after bar 2 is an up bar and yesterdays high volume zone.
bar 3 and bar 4 down bars narrow to average spread volume is comparatively low.

what caught my attention is bar 5, look at that very narrow spread and sudden increase in volume, and next bar up, NO EvR

And bar 7 No supply/Test gave me the confirmation...

Attached Image (click to enlarge)
Click to Enlarge

Name: Screenshot (137).png
Size: 31 KB
Attached Image (click to enlarge)
Click to Enlarge

Name: Screenshot (138).png
Size: 38 KB
Learning is a never ending Journey
 
6
  • Post #35,433
  • Quote
  • Feb 3, 2022 9:57am Feb 3, 2022 9:57am
  •  PranithR
  • Joined Jul 2021 | Status: Learning is never ending journey | 101 Posts
Quoting SyntaxError
Disliked
Pranith Please can you describe for me now you defined that bar on USDJPY as a failed test ? The definition (SOW 86) calls for I believe a wide spread down bar closing on the lows with the low and close lower than the previous few bars Not nitpicking I just would like to know your definition so we all learn something from this good shortable set up Thanks
Ignored
Hai, I believe Hidden Gap and Paul's reply answered your question.
I don't use Tradeguider so I don't look for specific entry patterns sequence. I picked up some of the manual methods laid out by Malcolm, Pres, Hidden Gap and Anotan. I apply my learnings which I learned reading each of their posts in this thread and Master The Markets.
I'm still learning
Learning is a never ending Journey
 
2
  • Post #35,434
  • Quote
  • Feb 3, 2022 11:48am Feb 3, 2022 11:48am
  •  Paulscaff1
  • Joined Feb 2021 | Status: Member | 599 Posts
Quoting SyntaxError
Disliked
Combination of very powerful (Volume Price Analysis) VPA signals that conform strictly to the Wyckoff and Tom's Rule Sets as published by them with some extra bells and whistles i have added for trade management and a few other nifty tools Such as we place momentum and energy for each pair, entry points and exit points add the Mojo and VPA exact status (and of course dissecting the currency which drives the whole show) see ForexEarlyWarning for a simple but powerful methodology that works on Currency trading The attached is what i call a 7 banger...
Ignored
Nice one mate.

Thanks for the detailed response
 
1
  • Post #35,435
  • Quote
  • Feb 4, 2022 3:29am Feb 4, 2022 3:29am
  •  Anotan
  • Joined Jan 2015 | Status: Member | 1,050 Posts
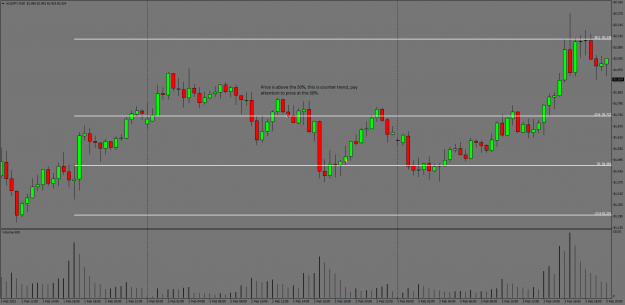
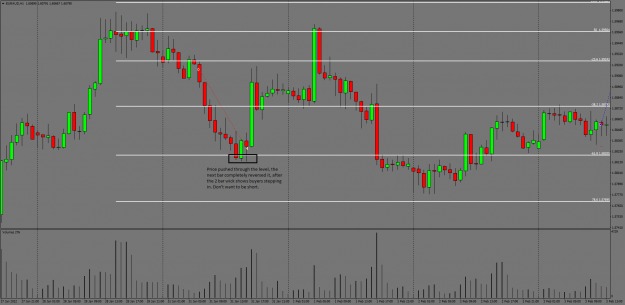
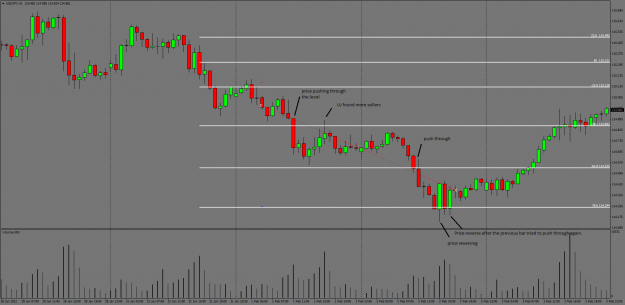
Something I've been playing with for a few weeks, keep in mind this is completely use at your own risk. The idea behind using this fib is to keep me in trades longer, especially right now since the market is in trend mode, soo many pips to be made right now. I haven't done all of my homework yet, I'm imagining that during ranging times, price will likely make large spikey movements up to the 23 or the 38, but thats just theory at this point.

I have no idea if tradable entries will line up with it, I haven't done the leg work for entries and don't plan on doing it. Like I said, the sole intention of this was just a way to keep me in trades longer. So far it seems to fit that role, so I'm sharing.

Basically just fib the previous day's highest volume bar like you would for VZA, and watch how price reacts to the levels, if price pushes through the level, then great hold the trade (possibly move up your stop if you like) and watch for the next level. If price struggles / starts to stall / a wide spread bar in your direction then close it out or take a partial. The thing I really like about this, is that as you move away from the 50% the amount of pips increases between each level so in-turn it increases the potential of you being able to hold onto big runners.

The fib levels are..

+123.5% > 9.236
100% > 7.000
78.6% > 4.786
61.8% > 3.618
38.2% > 2.382
23.6% > 1.236
50% > 0.500
-23.6% > -0.236
-38.2% > -1.382
-61.8% > -2.618
-78.6% > -3.786
-100% > -6.000
-123.6% > -8.236
Attached Images (click to enlarge)
Click to Enlarge

Name: AUDJPYM30.png
Size: 34 KB Click to Enlarge

Name: EURAUDH1.png
Size: 41 KB Click to Enlarge

Name: USDJPYH1.png
Size: 40 KB
Trading isn't about being right, it's about exploiting your edge.
 
6
  • Post #35,436
  • Quote
  • Feb 4, 2022 4:19am Feb 4, 2022 4:19am
  •  Paulscaff1
  • Joined Feb 2021 | Status: Member | 599 Posts
Quoting Anotan
Disliked
Something I've been playing with for a few weeks, keep in mind this is completely use at your own risk. The idea behind using this fib is to keep me in trades longer, especially right now since the market is in trend mode, soo many pips to be made right now. I haven't done all of my homework yet, I'm imagining that during ranging times, price will likely make large spikey movements up to the 23 or the 38, but thats just theory at this point. I have no idea if tradable entries will line up with it, I haven't done the leg work for entries and don't...
Ignored
Looks interesting mate, price definetely seems to be reacting to those levels in some way.
 
2
  • Post #35,437
  • Quote
  • Feb 7, 2022 7:45am Feb 7, 2022 7:45am
  •  PranithR
  • Joined Jul 2021 | Status: Learning is never ending journey | 101 Posts
Quoting Anotan
Disliked
Something I've been playing with for a few weeks, keep in mind this is completely use at your own risk. The idea behind using this fib is to keep me in trades longer, especially right now since the market is in trend mode, soo many pips to be made right now. I haven't done all of my homework yet, I'm imagining that during ranging times, price will likely make large spikey movements up to the 23 or the 38, but thats just theory at this point. I have no idea if tradable entries will line up with it, I haven't done the leg work for entries and don't...
Ignored
Thanks for sharing Anotan. Looks Interesting
Learning is a never ending Journey
 
2
  • Post #35,438
  • Quote
  • Feb 7, 2022 9:25am Feb 7, 2022 9:25am
  •  Anotan
  • Joined Jan 2015 | Status: Member | 1,050 Posts
Quoting PranithR
Disliked
{quote} Thanks for sharing Anotan. Looks Interesting
Ignored
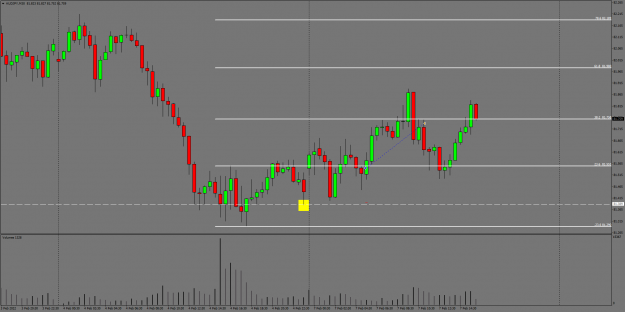
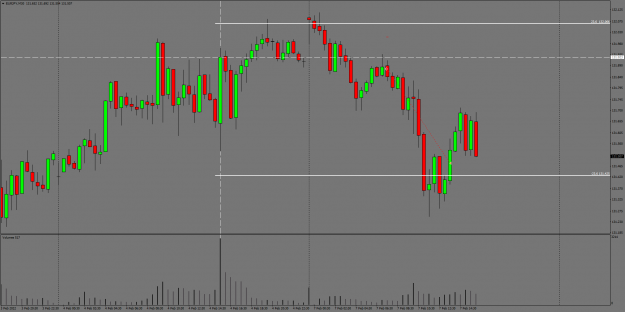
There does seem to be some validity to it. I think at the moment I'm cautiously optimistic about it.

I might have jumped out too soon today with it on an AJ long and EJ short.
Attached Images (click to enlarge)
Click to Enlarge

Name: AUDJPYM30.png
Size: 54 KB Click to Enlarge

Name: EURJPYM30.png
Size: 59 KB
Trading isn't about being right, it's about exploiting your edge.
 
3
  • Post #35,439
  • Quote
  • Feb 8, 2022 1:05am Feb 8, 2022 1:05am
  •  PranithR
  • Joined Jul 2021 | Status: Learning is never ending journey | 101 Posts
Namasthe Friends,
Does anyone use correlation to find out the best pairs to put in the watchlist for both short-term and long term, I always tend to confuse in finding this.
If yes, teach me also
any suggestions, advice and help much appreciated.
TIA
Learning is a never ending Journey
 
2
  • Post #35,440
  • Quote
  • Feb 8, 2022 1:36am Feb 8, 2022 1:36am
  •  Paulscaff1
  • Joined Feb 2021 | Status: Member | 599 Posts
Quoting PranithR
Disliked
Namasthe Friends, Does anyone use correlation to find out the best pairs to put in the watchlist for both short-term and long term, I always tend to confuse in finding this. If yes, teach me also any suggestions, advice and help much appreciated. TIA
Ignored
Im just guessing here, but Syntax gave some clues regarding currency strength/weakness which could be a usefull filter.
 
1
  • Interactive Trading
  • /
  • vsa with Malcolm
  • Reply to Thread
    • 1 17701771Page 177217731774 1784
    • 1 Page 1772 1784
6 traders viewing now, 2 are members:
bandler
,
Invisible
  • More
Top of Page
Forex Factory Blog Updated: Alerting All Members
  • Facebook
  • Twitter
About FF
  • Mission
  • Products
  • User Guide
  • Media Kit
  • Blog
  • Contact
FF Products
  • Forums
  • Trades
  • Calendar
  • News
  • Market
  • Brokers
  • Trade Explorer
FF Website
  • Homepage
  • Search
  • Members
  • Report a Bug
Follow FF
  • Facebook
  • Twitter

FF Sister Sites:

  • Metals Mine
  • Energy EXCH
  • Crypto Craft

Forex Factory® is a brand of Fair Economy, Inc.

Terms of Service / ©2022