• Home
  • Forums
  • Trades
  • News
  • Calendar
  • Market
  • Brokers
  • Login
  • Join
  • User/Email: Password:
  • 7:20am
Menu
  • Forums
  • Trades
  • News
  • Calendar
  • Market
  • Brokers
  • Login
  • Join
  • 7:20am
Sister Sites
  • Metals Mine
  • Energy EXCH
  • Crypto Craft

Options

Bookmark Thread

First Page First Unread Last Page Last Post

Print Thread

Similar Threads

VSA-divergence trading 187 replies

How to Blow $200 account using VSA--- 594 replies

VSA Journal 57 replies

VSA broker history change datas 11 replies

  • Interactive Trading
  • /
  • Reply to Thread
  • Subscribe
  • 12,008
Attachments: vsa with Malcolm
Exit Attachments

vsa with Malcolm

  • Last Post
  •  
  • 1 17471748Page 174917501751 1784
  • 1 Page 1749 1784
  •  
  • Post #34,961
  • Quote
  • Nov 15, 2021 7:07pm Nov 15, 2021 7:07pm
  •  procmail
  • | Joined May 2018 | Status: Member | 146 Posts
Quoting Paulscaff1
Disliked
{quote} Thats a good question about VZA mate, im glad you asked. The initial appeal of VZA is that I felt that it had some similarities to how I was trading before (using SD zones/order blocks) Just before Malcolm popped back I was using a combination of marking the zones plus marking the OR. I smugly thought that this would give an extra edge but really it was just a filter to take less trades as there was often 2 opposing rules so I decided at the time to discount the OR and use only VZA. My plan was to use no timeframes less than M15/M30 and...
Ignored
Thanks for sharing your thoughts.

I've been testing the OR too and was wondering how to fit it into the VZA approach, or whether it's an either-or thing. Add to that, I also use zones based on strong Weis Waves, so everything starts to get overwhelming. Especially when they conflict.


  1. But then I thought about it: they are all just high volume/activity areas, so I started to think of them like how I used to think of Support/Resistance zones. They don't have to be mutually exclusive - just use whichever is nearest.
  2. For me, if 2 zones are very close, I combine them into one zone so it's fibbed as one. I would not like to trade from one zone right into another zone, just as I would not want to trade from a local Support line right into a Resistance line.
  3. Also, I came across this post by Pres, with both the OR and Yesterday's High Volume zone on the same chart. Good info on how he handles YHVZ and OR:
    https://www.forexfactory.com/thread/...01#post8706601

 
4
  • Post #34,962
  • Quote
  • Edited Nov 16, 2021 3:04am Nov 15, 2021 7:41pm | Edited Nov 16, 2021 3:04am
  •  Paulscaff1
  • Joined Feb 2021 | Status: Member | 599 Posts
Quoting procmail
Disliked
{quote} Thanks for sharing your thoughts. I've been testing the OR too and was wondering how to fit it into the VZA approach, or whether it's an either-or thing. Add to that, I also use zones based on strong Weis Waves, so everything starts to get overwhelming. Especially when they conflict. But then I thought about it: they are all just high volume/activity areas, so I started to think of them like how I used to think of Support/Resistance zones. They don't have to be mutually exclusive - just use whichever is nearest. For me, if 2 zones are very...
Ignored
Thanks for your input mate. Yeah Prez uses todays LO HVZ and sometimes NYO HVZ depending on where they lie.

Im sure all the high/ultra high vol zones definetely hold a ton of value and you definetely see reactions from them.
VZA imo is very similair to the first rules of "Toms Simple Trending System" which im guessing is basic VSA.

• Identify a serious sign of strength first, such as a Bottom Reversal, Selling Climax or Ultra High Volume or Low Volume . Look out for Shakeouts. These should be followed by a Test or No Supply.

• Wait for at least 10 BARS IN ANY TIMEFRAME to see the result of the strength.

• In a strong uptrend we should see decreasing volume (not excessive or ultra high) on down bars and increasing volume on up bars (again, not excessive or ultra high)

• In a uptrend you can allow for 1 down bar if they are on low /average volume. Ignore level bars or near level bars, that is a bar that has closed at or near the same price as previous bar.

• The end of the uptrend is often seen by two consecutive down bars followed by a NO DEMAND up bar

Obviously this is for long entries and would be reverse of this for short entries, plus VZA has additional rules about where the entries can be taken based on the fib levels.

Ive still got VZA in the back of my mind as well as other methods of using VSA including the one above, which I guess look almost like the way GH trades in his videos.

Tough part for me psychologically is giving a method long enough before moving onto the next, and knowing when the right time to do that is I.E moving from VZA to OR etc
 
3
  • Post #34,963
  • Quote
  • Nov 16, 2021 7:46am Nov 16, 2021 7:46am
  •  Paulscaff1
  • Joined Feb 2021 | Status: Member | 599 Posts
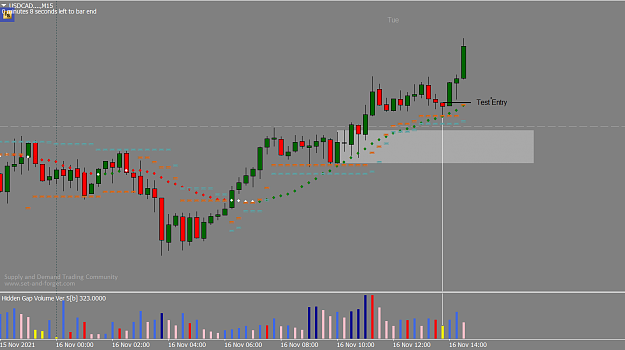
USDCAD-M15

Hesitated on this one
Attached Image (click to enlarge)
Click to Enlarge

Name: 2bdaebb14052bfcba205e6b05b1d0140.png
Size: 33 KB
 
2
  • Post #34,964
  • Quote
  • Nov 17, 2021 3:58am Nov 17, 2021 3:58am
  •  Paulscaff1
  • Joined Feb 2021 | Status: Member | 599 Posts
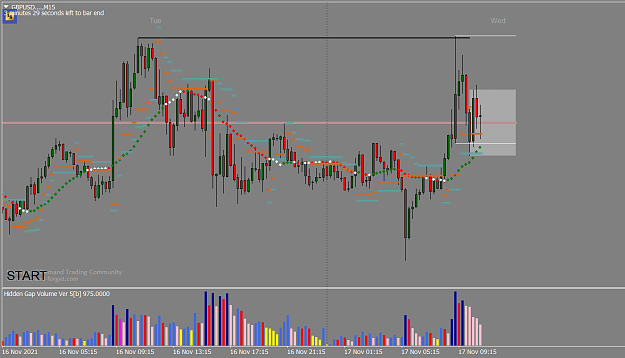
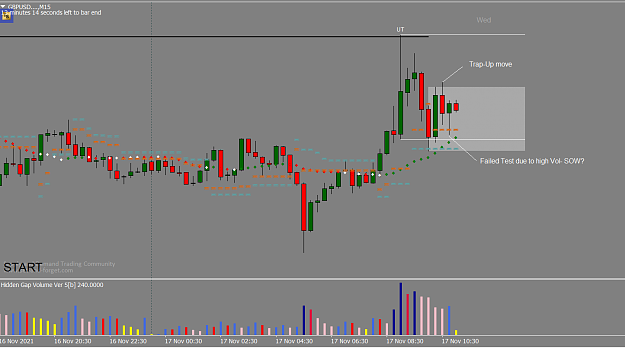
GBPUSD looks interesting UHV upthrust into yesterdays high. Potential Top

Lets see if a shorting opportunity presents
Attached Images (click to enlarge)
Click to Enlarge

Name: 9c8c4e16dcdd784838972b900f9a05e1.png
Size: 46 KB Click to Enlarge

Name: 0d8298a504a65b49f7619529f9463a55.png
Size: 38 KB
 
4
  • Post #34,965
  • Quote
  • Nov 17, 2021 4:12am Nov 17, 2021 4:12am
  •  Anotan
  • Joined Jan 2015 | Status: Member | 1,050 Posts
Quoting Paulscaff1
Disliked
GBPUSD looks interesting UHV upthrust into yesterdays high. Potential Top Lets see if a shorting opportunity presents {image} {image}
Ignored
I think youre forgetting about that unusual climatic action that happened at 05:00 on your chart. I wouldnt short above that area. I mean follow your plan, just be cautious of area.

I have some EC longs running just based on that.
Trading isn't about being right, it's about exploiting your edge.
 
2
  • Post #34,966
  • Quote
  • Edited at 4:57am Nov 17, 2021 4:24am | Edited at 4:57am
  •  Paulscaff1
  • Joined Feb 2021 | Status: Member | 599 Posts
Quoting Anotan
Disliked
{quote} I think youre forgetting about that unusual climatic action that happened at 05:00 on your chart. I wouldnt short above that area. I mean follow your plan, just be cautious of area. I have some EC longs running just based on that.
Ignored
Thanks for mentioning mate, I totally overlooked that.

"Missing the forest for the trees"
 
2
  • Post #34,967
  • Quote
  • Nov 17, 2021 6:12am Nov 17, 2021 6:12am
  •  Anotan
  • Joined Jan 2015 | Status: Member | 1,050 Posts
Quoting Paulscaff1
Disliked
{quote} "Missing the forest for the trees"
Ignored
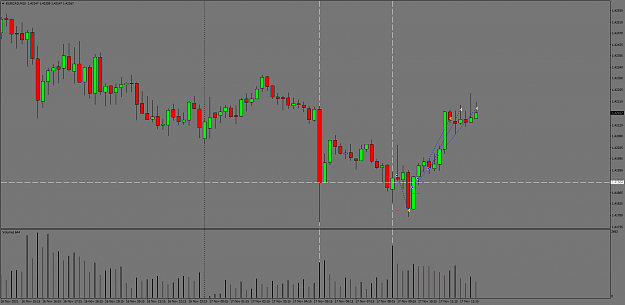
I did have a little advantage. I was watching the euro crosses when that bar printed and price was moving quickly and jumping in 3-4 pip blocks. No doubt professionals were active, bars like that you mark off the levels that you watch and go to town.

I jumped in early on this trade and had to pay the price for it, loss was around 14 pips and average win was 26 pips. I wanted to dump this at the previous high, but price is really struggling with the high of the climatic bar so it was easier to just take profits and run.
Attached Image (click to enlarge)
Click to Enlarge

Name: EURCADM15.png
Size: 55 KB
Trading isn't about being right, it's about exploiting your edge.
 
4
  • Post #34,968
  • Quote
  • Nov 17, 2021 9:37am Nov 17, 2021 9:37am
  •  Macallik
  • | Joined Sep 2010 | Status: Member | 121 Posts
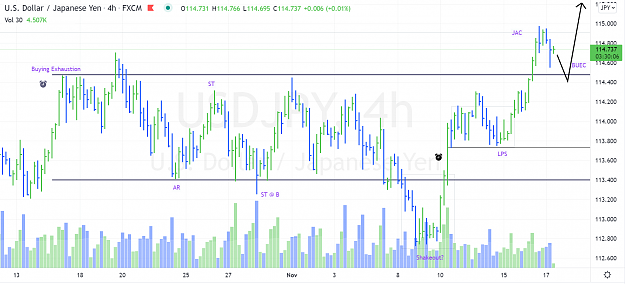
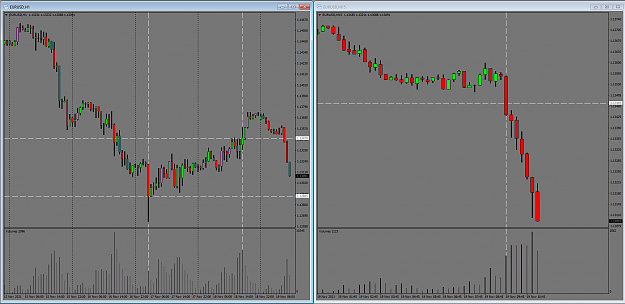
Stalking USDJPY. Will be using VSA to look for signs of No Demand or Climatic volume

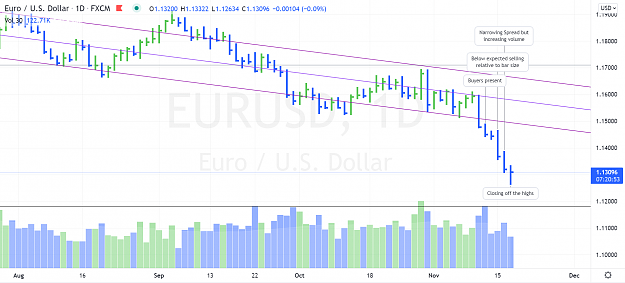
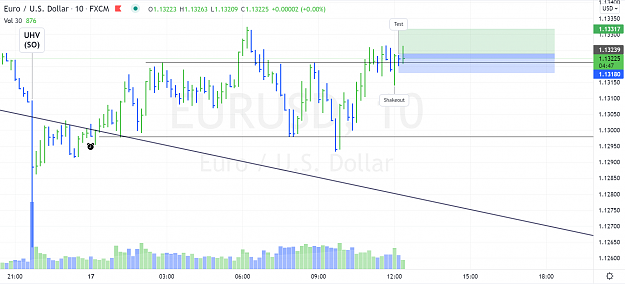
Also watching EURUSD. Buyers are coming in but it could possibly be preliminary support and price could still drift down to ~1.12 even with the professional traders buying.
Attached Images (click to enlarge)
Click to Enlarge

Name: e4e9966fcb2cc2b8e33554aebeea2a0d.png
Size: 205 KB Click to Enlarge

Name: bdbac53cef3015717daee9a0070865a1.png
Size: 194 KB
 
4
  • Post #34,969
  • Quote
  • Edited at 1:43pm Nov 17, 2021 1:25pm | Edited at 1:43pm
  •  Macallik
  • | Joined Sep 2010 | Status: Member | 121 Posts
Has been going against me as soon as I entered but jumped into EURUSD w/ a tight stop:


Edit: Stopped out
Attached Image (click to enlarge)
Click to Enlarge

Name: a59bb733dc0481981c99c5700e5f5e9e.png
Size: 167 KB
 
2
  • Post #34,970
  • Quote
  • Nov 17, 2021 2:48pm Nov 17, 2021 2:48pm
  •  bandler
  • Joined Apr 2020 | Status: Member | 59 Posts
Quoting Anotan
Disliked
{quote} I think youre forgetting about that unusual climatic action that happened at 05:00 on your chart. I wouldnt short above that area. I mean follow your plan, just be cautious of area. I have some EC longs running just based on that.
Ignored
This is where I get confused with VSA, you had that strength at 5 o'clock, but then you have that colossal volume upbar closing off the high, I look to the left and it hasn't broken an old top or through resistance from what I see, Anotan what made you gage that the 5 o'clock was stronger than the alleged weak bar???

Hope that makes sense

Cheers
 
3
  • Post #34,971
  • Quote
  • Edited at 3:36pm Nov 17, 2021 3:03pm | Edited at 3:36pm
  •  Paulscaff1
  • Joined Feb 2021 | Status: Member | 599 Posts
Quoting bandler
Disliked
{quote} This is where I get confused with VSA, you had that strength at 5 o'clock, but then you have that colossal volume upbar closing off the high, I look to the left and it hasn't broken an old top or through resistance from what I see, Anotan what made you gage that the 5 o'clock was stronger than the alleged weak bar??? Hope that makes sense Cheers
Ignored
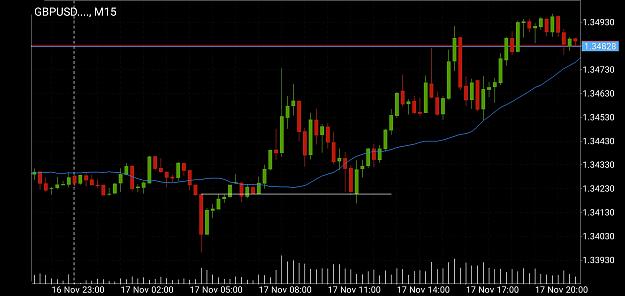
In hindsight I notice that the climactic upbar wasnt confirmed with the next bar closing down which is something I missed at the time which probably gave a clue that there wasnt as much weakness as initially thought.

I did notice a nice 2 bar reversal that reacted of the bottom HV trigger to continue the upmove. But im thinking that would be a risky play due to the potential resistance of the UHV bar, zone sandwich.
Attached Image (click to enlarge)
Click to Enlarge

Name: Screenshot_20211117-200219_MetaTrader 4.jpg
Size: 526 KB
 
1
  • Post #34,972
  • Quote
  • Nov 17, 2021 7:07pm Nov 17, 2021 7:07pm
  •  Anotan
  • Joined Jan 2015 | Status: Member | 1,050 Posts
Quoting bandler
Disliked
{quote} This is where I get confused with VSA, you had that strength at 5 o'clock, but then you have that colossal volume upbar closing off the high, I look to the left and it hasn't broken an old top or through resistance from what I see, Anotan what made you gage that the 5 o'clock was stronger than the alleged weak bar??? Hope that makes sense Cheers
Ignored
I kinda explained this earlier, but I was watching the charts at the time the 5:00 bar happened, when it happened price was moving very fast. I was watching the euro crosses at the time and they were jumping in 3-4 pip blocks. EC for example price was 1.4190 then it would just jump straight to 1.4186, there was no in between. That was my clue that professionals were active at 5:00, and that I needed to watch how price reacted to the 5:00 bar. In the case of GU, price was well above the highs of the 5:00 bar, you just didn't want to be short above the 5:00 bar.

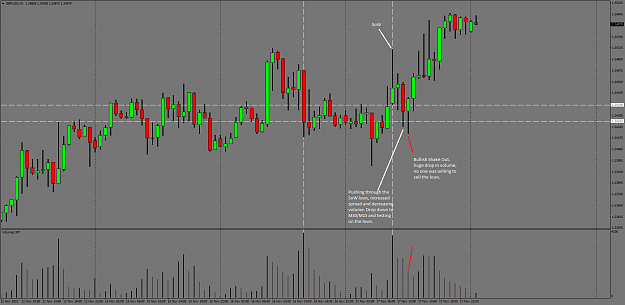
Lets look at this in another way, looking at an H1 chart on GU when you see an obvious SoW you have to pay attention to how price reacts to the low of SoW. When price pushes through the low, you want to see a down bar on increasing volume and spread. As price pushed down and through the SoW, there is an increase spread and body on the down bar, but the volume isn't increasing. You need to be cautious, you need to dig into that H1 bar and see what happened on it, which if you look at both the M30 and M15 in that down bar you will see testing on the lows. The next bar after the H1 down bar is a shakeout and very low volume, there is a big decrease in volume and price is pushing back up into the SoW. That shakeout is telling you that no one is selling the lows of the SoW, and you shouldn't be short.

I've mentioned this before, its an important lesson that if you aren't seeing the results you'd expect start looking at the other side. Its also good idea that if youre bearish to know where the bulls are.
Attached Image (click to enlarge)
Click to Enlarge

Name: GBPUSDH1.png
Size: 43 KB
Trading isn't about being right, it's about exploiting your edge.
 
9
  • Post #34,973
  • Quote
  • Nov 17, 2021 7:16pm Nov 17, 2021 7:16pm
  •  Anotan
  • Joined Jan 2015 | Status: Member | 1,050 Posts
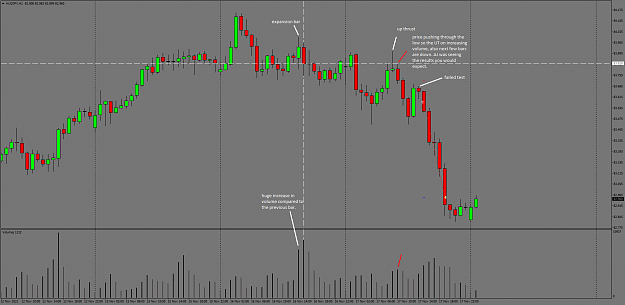
AJ short.

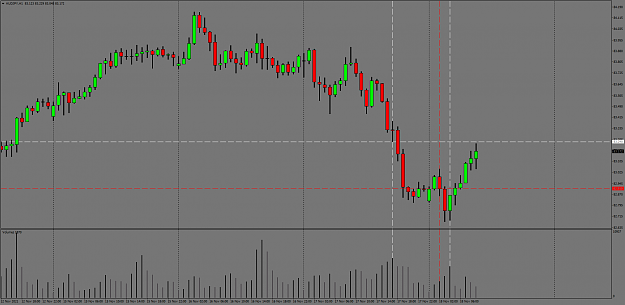
If you look at the expansion bar, the biggest increase in volume of the day. Look at how big that increase in volume is. That huge increase tells you that professional money is active, which that is what we do. We follow professional money.
Attached Image (click to enlarge)
Click to Enlarge

Name: AUDJPYH1.png
Size: 43 KB
Trading isn't about being right, it's about exploiting your edge.
 
8
  • Post #34,974
  • Quote
  • Edited at 11:51pm Nov 17, 2021 11:17pm | Edited at 11:51pm
  •  Anotan
  • Joined Jan 2015 | Status: Member | 1,050 Posts
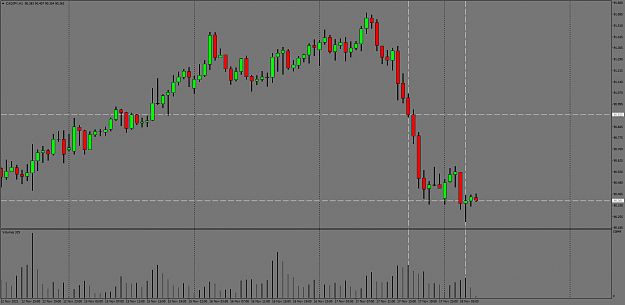
Keep an eye on CJ for longs.

CJ is a bit over extended from yesterday's PA and during Asia we've seen a bit of a shakeout.

Its still way too soon to place any trades. The reason why its still too soon to trade is we need to see the high of the shakeout taken out, after the high is taken out give it a few hours so the pair has some time to react to the close. If you see wide spread down bar pushing through the close or pushing through the low then scrub this setup, it's not longer valid.

Attached Image (click to enlarge)
Click to Enlarge

Name: CADJPYH1.png
Size: 61 KB

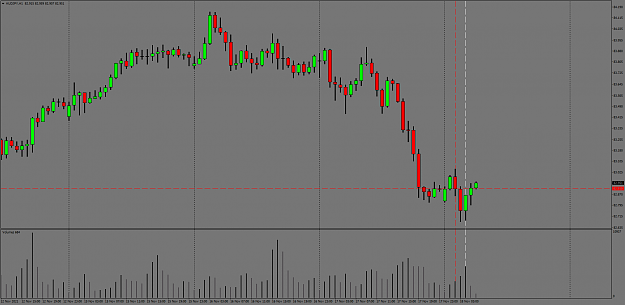
If you take a look at AJ, its kinda the same story as CJ. The difference is that AJ has some weakness on the red cross hairs. So you have to be mindful of that and pay attention to how price reacts to the weakness as well as how it reacts to the strength.

Attached Image (click to enlarge)
Click to Enlarge

Name: AUDJPYH1.png
Size: 61 KB

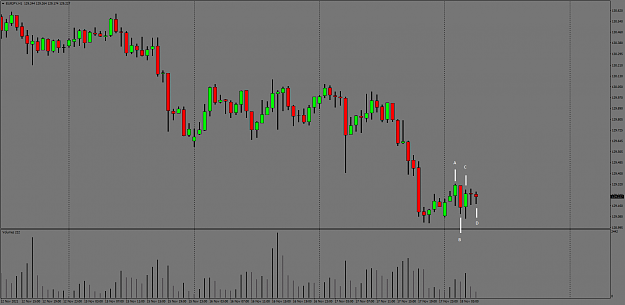
Just following the JPY trend. EJ really isn't that interesting.

A- A little bit of strength came in early Asia.

B - Wide spread down bar, this is not what you would expect from the strength on Bar A. You don't want to see widespread down bars after strength.

C- More strength coming in.

D- Still about 15 mins left on this bar, but you can tell this bar is testing the strength on Bar C. EJ may still end up being bullish, but with Bar B reacting to A. I'm not interested. Ill end up closing this chart and moving on.

Attached Image (click to enlarge)
Click to Enlarge

Name: EURJPYH1.png
Size: 31 KB
Trading isn't about being right, it's about exploiting your edge.
 
6
  • Post #34,975
  • Quote
  • Nov 18, 2021 2:35am Nov 18, 2021 2:35am
  •  Anotan
  • Joined Jan 2015 | Status: Member | 1,050 Posts
Quoting Anotan
Disliked
Keep an eye on CJ for longs.
Ignored
Unfortunately nothing really came of this.

AJ never pulled back to test 82.90 and just went straight up to yesterday's highest volume bar. So for me AJ/CJ are both invalid, wait and see what happens after LO, there could be a chance that London sells and we could find a short running back into the lows. But for now nothing worth watching.
Attached Image (click to enlarge)
Click to Enlarge

Name: AUDJPYH1.png
Size: 64 KB
Trading isn't about being right, it's about exploiting your edge.
 
6
  • Post #34,976
  • Quote
  • Edited at 9:10am Nov 18, 2021 8:44am | Edited at 9:10am
  •  Paulscaff1
  • Joined Feb 2021 | Status: Member | 599 Posts
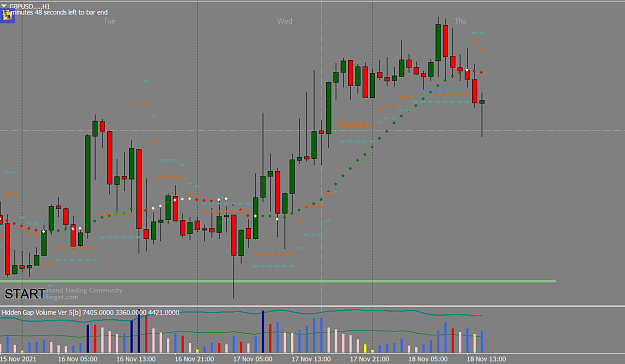
Anotan, this is a what if question. Assuming if this is how the current H1 bar closes to form this shakeout, would you simply be looking for any tests/ no supply to get long? (on H1 or lower).
Attached Image (click to enlarge)
Click to Enlarge

Name: b72f51dbc1abf01f9dcae7ac6f02573d.png
Size: 40 KB
 
1
  • Post #34,977
  • Quote
  • Nov 18, 2021 9:57am Nov 18, 2021 9:57am
  •  Anotan
  • Joined Jan 2015 | Status: Member | 1,050 Posts
Quoting Paulscaff1
Disliked
Anotan, this is a what if question. Assuming if this is how the current H1 bar closes to form this shakeout, would you simply be looking for any tests/ no supply to get long? (on H1 or lower). {image}
Ignored
I hardly ever take trades based on the current day PA during the US session.

I don't trade pound, but based on how I trade other pairs I would put the most weight on the pairs home session, in this case London session. Today's London you have a 2 bar reversal at the top which a couple of bars later is an ugly test. The reaction to that test would make me look for shorts.

I'd imagine that price wants to revisit and test that high volume close of supply bar from yesterdays London session.
Trading isn't about being right, it's about exploiting your edge.
 
2
  • Post #34,978
  • Quote
  • Nov 18, 2021 12:32pm Nov 18, 2021 12:32pm
  •  oliwand
  • | Membership Revoked | Joined Apr 2012 | 57 Posts
Quoting copi88
Disliked
{quote} This is a program called Bookmap it shows the limit order book. The white lines are resting Limit Orders ie Liquidity. The thicker the white lines the heavier the liquidity. Liquidity acts like a magnet for price. See how they add in liquidity below the market at the purple arrows and price trades down towards it. But this is not true liquidity because as soon as price gets there they pull it. They are spoofing the market. When price gets to 1.20780 they pull all the liquidity below the market and start adding it above, and price starts...
Ignored
You who have already lost everything and are looking for a way to get your money back, stay away from all the EA’s, indicators, softwares as Metatrader, Jigsaw, Sierra, Bookmap and all other. Understanding the options on the futures is the only thing that will help you efficiently.
 
 
  • Post #34,979
  • Quote
  • Nov 18, 2021 5:33pm Nov 18, 2021 5:33pm
  •  Paulscaff1
  • Joined Feb 2021 | Status: Member | 599 Posts
Quoting Anotan
Disliked
{quote} I hardly ever take trades based on the current day PA during the US session. I don't trade pound, but based on how I trade other pairs I would put the most weight on the pairs home session, in this case London session. Today's London you have a 2 bar reversal at the top which a couple of bars later is an ugly test. The reaction to that test would make me look for shorts. I'd imagine that price wants to revisit and test that high volume close of supply bar from yesterdays London session.
Ignored
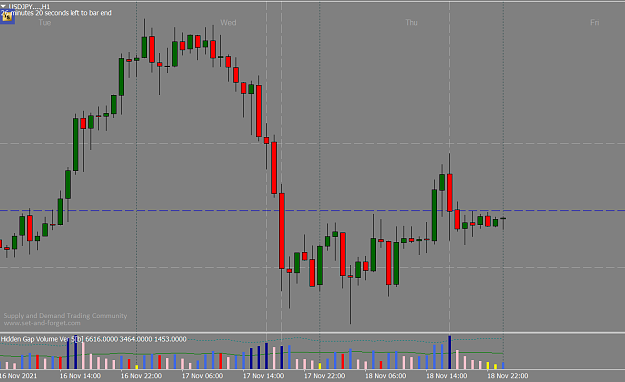
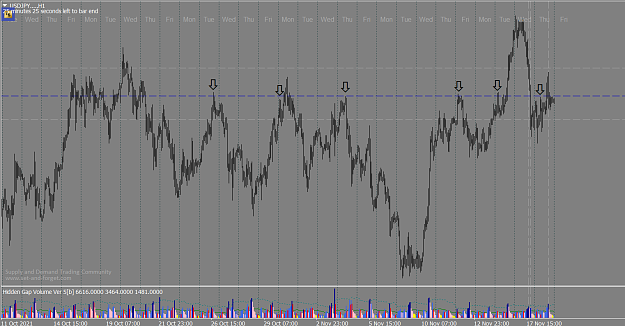
I just noticed something interesting on USDJPY using your HVC
.
I marked of the most recent HVC (blue) and noticed how often this line acted as support/resistance in the past.

Kind of like a high volume pivot.
Attached Images (click to enlarge)
Click to Enlarge

Name: f07928804604c8268e4e1d4e4227147c.png
Size: 27 KB Click to Enlarge

Name: 6957a16fb986fa37f4415250872e7d02.png
Size: 43 KB
 
2
  • Post #34,980
  • Quote
  • Nov 19, 2021 4:26am Nov 19, 2021 4:26am
  •  Anotan
  • Joined Jan 2015 | Status: Member | 1,050 Posts
I was eyeballing EU today.

Price has moved straight up since that 5:00 bar on Wednesday. I was looking for price to test yesterday's HVC but as you can see price marked very quickly through that close.

Right now price looks as it might be finding some strength, but its not in my trading plan to go long with such as quick mark down though the HVC. But that's trading, not everyday that you will find a trade, not everyday that you will make profit.

Next week is Thanksgiving in the US and Ill be taking the week off. Take care.

Attached Image (click to enlarge)
Click to Enlarge

Name: EURUSDH1.png
Size: 80 KB

Attached Image
Trading isn't about being right, it's about exploiting your edge.
 
7
  • Interactive Trading
  • /
  • vsa with Malcolm
  • Reply to Thread
    • 1 17471748Page 174917501751 1784
    • 1 Page 1749 1784
0 traders viewing now
  • More
Top of Page
Forex Factory Blog Updated: Alerting All Members
  • Facebook
  • Twitter
About FF
  • Mission
  • Products
  • User Guide
  • Media Kit
  • Blog
  • Contact
FF Products
  • Forums
  • Trades
  • Calendar
  • News
  • Market
  • Brokers
  • Trade Explorer
FF Website
  • Homepage
  • Search
  • Members
  • Report a Bug
Follow FF
  • Facebook
  • Twitter

FF Sister Sites:

  • Metals Mine
  • Energy EXCH
  • Crypto Craft

Forex Factory® is a brand of Fair Economy, Inc.

Terms of Service / ©2022