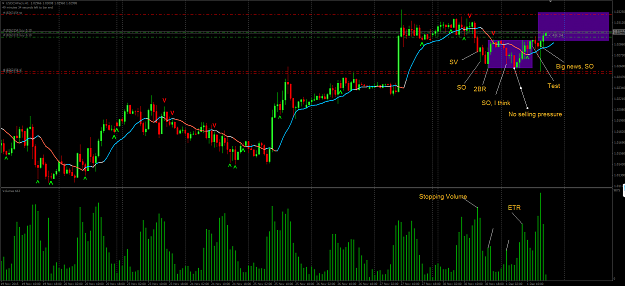
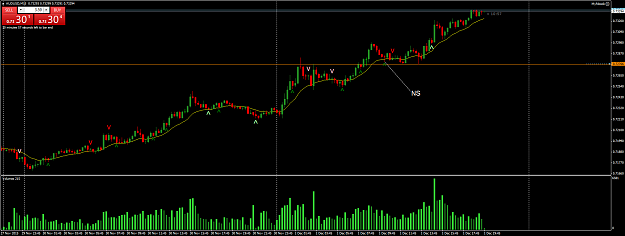
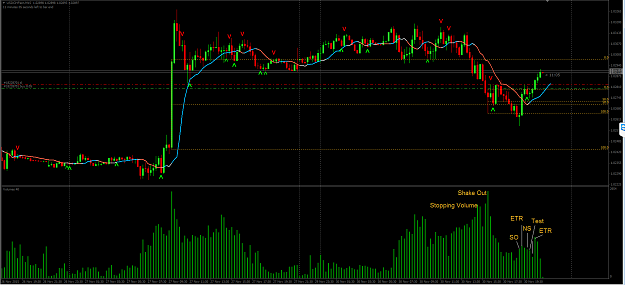
USDCHF long I took...comments appreciated
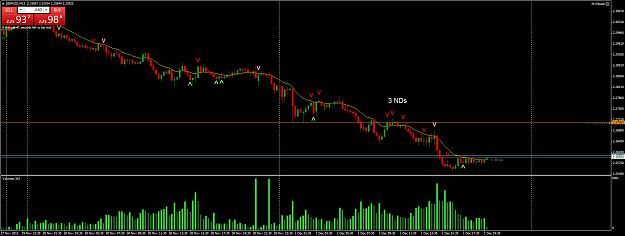
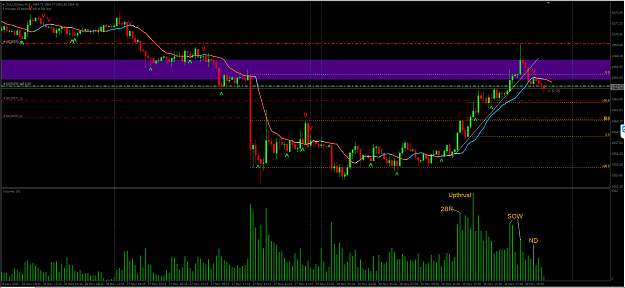
GOLD short, 1hr is nice pin at previous support turned resistance
Attached Image (click to enlarge)
GOLD short, 1hr is nice pin at previous support turned resistance
Attached Image (click to enlarge)