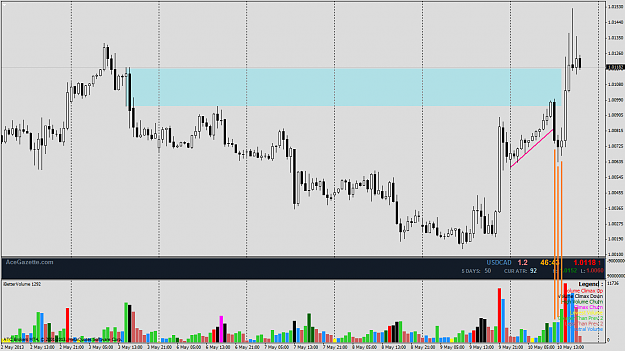
DislikedI'm short EJ, just thought i'd say it in real time instead of my usual after the fact posts.I'll post a follow up chart later on some stage.
Ignored
Anywho, i'll give the reasons for entering the trade and what i've learnt from it.
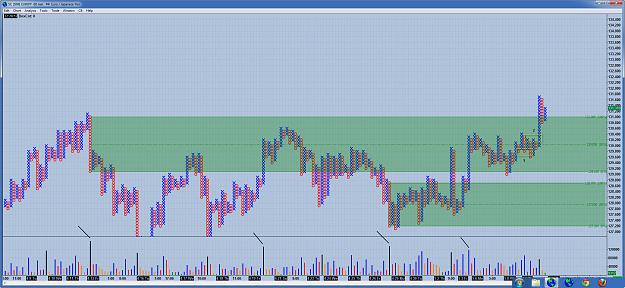
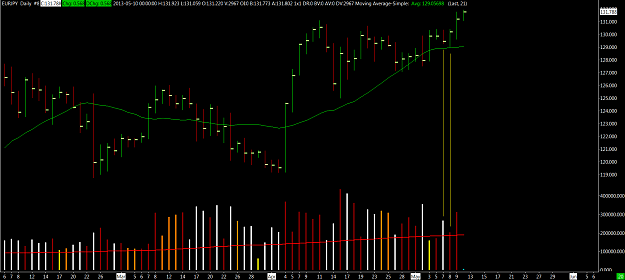
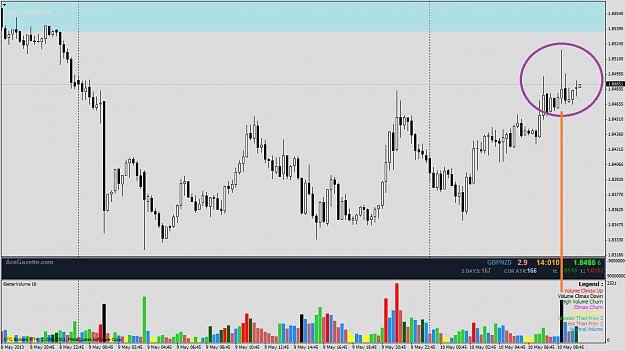
The chart is wide screen so you will probably need to zoom in a bit. The upper zone is the zone that formed the basis of the trade. It's a zone from the 12th April and the highest volume in this area. Again, cumulative volume based on the PnF columns. The first and third marked ones have green zones and the other two marked bars (second and fourth) are columns of interest. I didn't highlight them in green to avoid clutter.
The second marked column is weakness at the 50% of the upper zone and the market fell from here. I figured we had a similar scenario with the fourth marked column but unfortunately not.
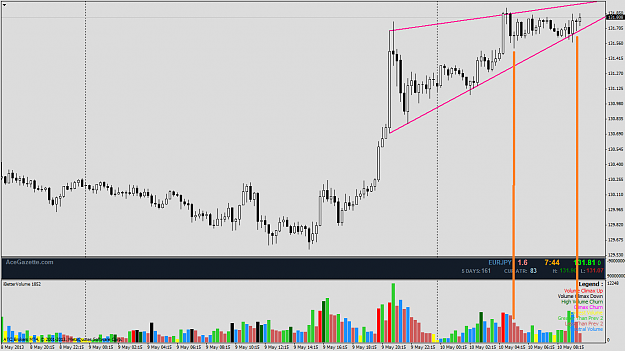
I got my numbers wrong on the chart, but the 1st marked yellow box is where I took my short, a triple bottom sell, like the NU trade I posted earlier I thought this was a rejection of the 50% and we were pushing down from here.
My stop was 60 pips and I got stopped as it formed the triple top buy (second yellow box) breaking through the 50% and heading north and north.... and north.
I decided not to take the long as I didn't want to chase the trade, i've been caught before in a sideways market with sell and buy signals in quick succession so decided to sit it out. Turns out I should've taken the long signal!
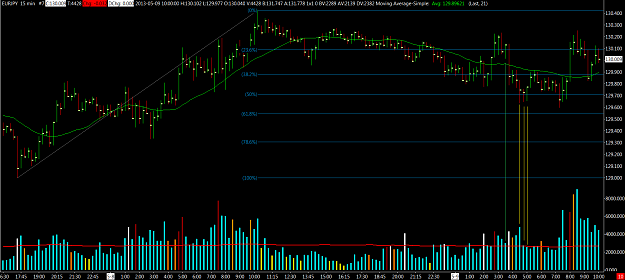
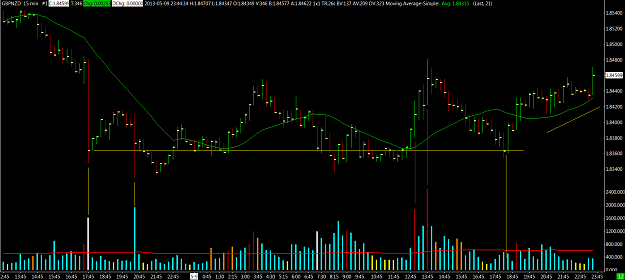
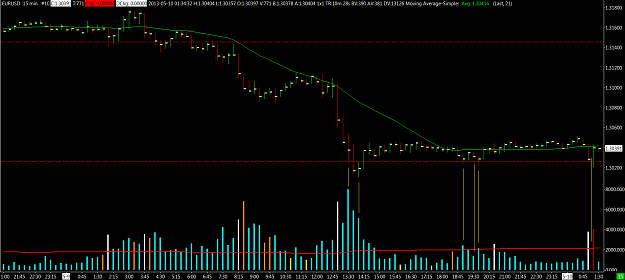
As far as I what i've learnt from the trade. Looking at the 1hr / 15min HLC chart now, I thought I was seeing weakness, but looking again, it's not the clearest to me. As well as this, there's the up trend on the PnF chart from the low, there was a lot of buying on that lower zone and I think that came in to play here. The 50% of the second and fourth bars are pretty much where the market stopped at the low today. So there was a lot of strength at this area as was later proved.
Any other comments would be appreciated as always!
Attached Image (click to enlarge)