DislikedFailed Trade i prob shouldn't have taken. But failed trade is a trade worth looking still.
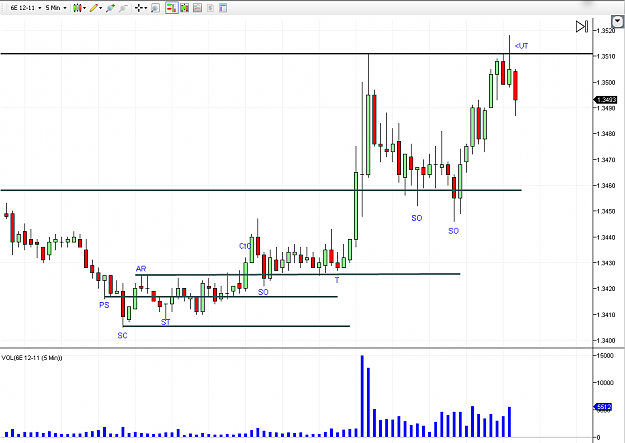
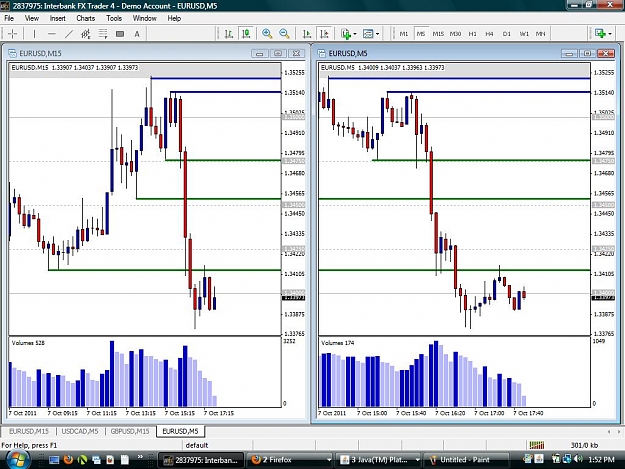
First x marks what i saw was support.
Second X marks a no supply bar which in retrospect i think could of valid.
Anyone wanna mark it up and let me know what went wrong?I know supply was present but like i said i saw support.Ignored
TBH, I found this chart very difficult.
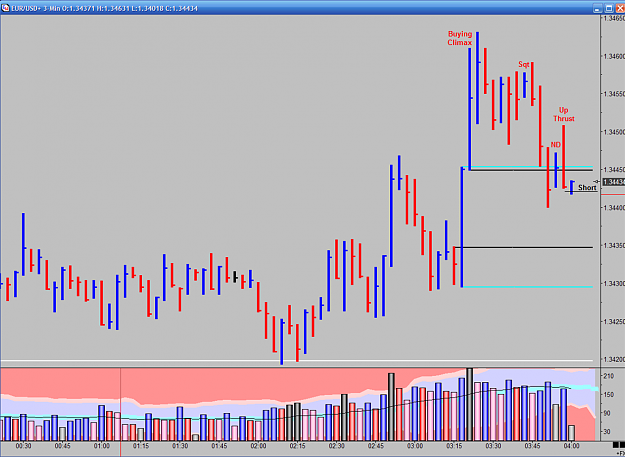
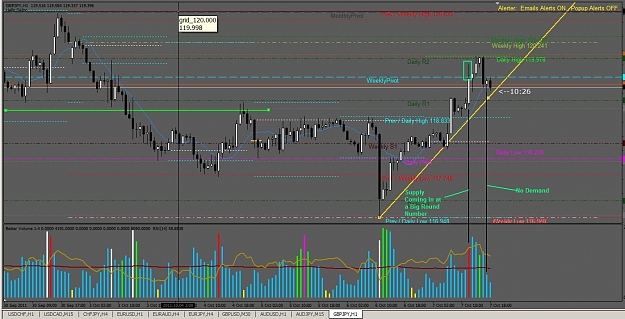
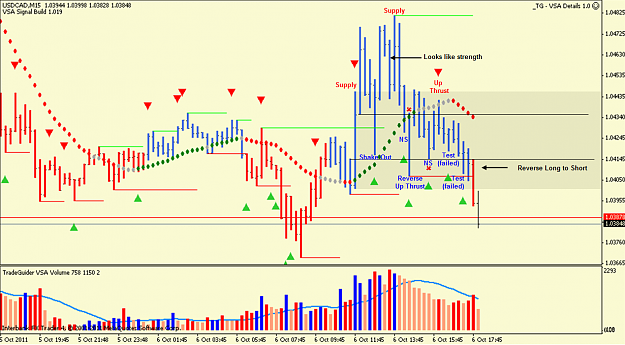
From my perspective, I think I would have made a Long entry either at the first "x" or the second "x". I see both as being in the right place with STRENGTH in the background. I honestly like the second "x" better because the volume is less than average and it is in the long shadow of the first "x", which I marked as a Reverse Up Thrust.
With a long entry after the NS, I would want my stop to be just below the RUT. But look what happens. There are two failed tests. The second of which takes prices below the low of the NS. In fact, the interval after the test actually dips down below the low of the RUT. If I was not stopped out, then it might be time to reverse and get short. If you are not the type to SAR a position, then you simply take a loss and move on to the next trade.
I do not know how you use the diamonds, but since they are on the chart I will make a few more comments. First, I would have a hard time getting long with price below the diamonds even at the second "x". Not only is price below them but they are grey. By the time of the second failed test the diamonds are red. This would give added confidence in doing a SAR.
But again, so as there is no confusion, I would have been looking to get long at the NS as you did since I don't use the daimonds.
Attached Image (click to enlarge)
Without VSA, you're playing checkers while the Smart Money plays chess.