• Home
  • Forums
  • Trades
  • News
  • Calendar
  • Market
  • Brokers
  • Login
  • Join
  • 4:38pm
Menu
  • Forums
  • Trades
  • News
  • Calendar
  • Market
  • Brokers
  • Login
  • Join
  • 4:38pm
Sister Sites
  • Metals Mine
  • Energy EXCH
  • Crypto Craft

Options

Bookmark Thread

First Page First Unread Last Page Last Post

Print Thread

Similar Threads

VSA-divergence trading 187 replies

How to Blow $200 account using VSA--- 594 replies

VSA Journal 57 replies

VSA broker history change datas 11 replies

  • Interactive Trading
  • /
  • Reply to Thread
  • Subscribe
  • 12,373
Attachments: vsa with Malcolm
Exit Attachments
Tags: vsa with Malcolm
Cancel

vsa with Malcolm

  • Last Post
  •  
  • 1 10541055Page 105610571058 1806
  • 1 Page 1056 1806
  •  
  • Post #21,101
  • Quote
  • Jun 15, 2011 7:21am Jun 15, 2011 7:21am
  •  NaughtyPip
  • Joined Aug 2010 | Status: Member | 1,282 Posts
Quoting J00
Disliked
Good morning and hello.

New here, but not to the concept.

Currently reading through your wonderful thread, on page 41 and I am keen to continue my education.

You have some wonderful and very informative posts that are well described etc etc.

I have many further questions relating to VSA, but I will take my time asking.

(sometimes you have to be ready to hear the answer).
Ignored
Hi there nice to have you on board - dont forget to read master the markets aswell.
 
 
  • Post #21,102
  • Quote
  • Jun 15, 2011 8:47am Jun 15, 2011 8:47am
  •  KinsaleForex
  • Joined Oct 2010 | Status: Looking at a few more charts... | 1,195 Posts
Quoting J00
Disliked
Good morning and hello.

New here, but not to the concept.

Currently reading through your wonderful thread, on page 41 and I am keen to continue my education.

You have some wonderful and very informative posts that are well described etc etc.

I have many further questions relating to VSA, but I will take my time asking.

(sometimes you have to be ready to hear the answer).
Ignored
Welcome from me as well! Another one over to the dark side
 
 
  • Post #21,103
  • Quote
  • Jun 15, 2011 9:40am Jun 15, 2011 9:40am
  •  pres78
  • Joined Sep 2010 | Status: I'm not here... or am I? | 3,999 Posts
Hey Intel,

It's great to have you back and sharing your insights again. Hope it works out and you can get back to taking some trades soon.
Today's zone = Tomorrow's opportunity!
 
 
  • Post #21,104
  • Quote
  • Jun 15, 2011 10:55am Jun 15, 2011 10:55am
  •  Intel
  • Joined Dec 2009 | Status: Member | 2,367 Posts
Quoting pres78
Disliked
Hey Intel,

It's great to have you back and sharing your insights again. Hope it works out and you can get back to taking some trades soon.
Ignored
Thanks for your kind comments. Just making a start for now.
 
 
  • Post #21,105
  • Quote
  • Jun 15, 2011 11:13am Jun 15, 2011 11:13am
  •  pipon
  • | Joined Mar 2011 | Status: Member | 190 Posts
Quoting Mtm
Disliked
anybody found anything wrong with IBFX volume? volume has been very low and Flat before and after the London Open...
Ignored
yes flat vol on IBFX ,looks like they have a problem,
until they fix it I can recommend the demo from gomarkets at gomarketsaus they are almost the same and both are very similar to TG
 
 
  • Post #21,106
  • Quote
  • Jun 15, 2011 11:28am Jun 15, 2011 11:28am
  •  bauerjj10
  • Joined Jul 2009 | Status: Member | 200 Posts
Quoting pipon
Disliked
yes flat vol on IBFX ,looks like they have a problem,
until they fix it I can recommend the demo from gomarkets at gomarketsaus they are almost the same and both are very similar to TG
Ignored

I spoke with there customer support and they have no clue. The guy told me that the volume is based off of ticks...*DUH* and that the charting program will produce the volume based on the tick data. So then I told him that their data feed must not be accurately providing tick data and he said no its just a slow day.

I am almost 100% confident that this is incorrect and they have no idea what is going on.
 
 
  • Post #21,107
  • Quote
  • Jun 15, 2011 12:06pm Jun 15, 2011 12:06pm
  •  Sonofsin5
  • Joined Jan 2009 | Status: Fading the specs | 1,374 Posts
Quoting bauerjj10
Disliked
I spoke with there customer support and they have no clue. The guy told me that the volume is based off of ticks...*DUH* and that the charting program will produce the volume based on the tick data. So then I told him that their data feed must not be accurately providing tick data and he said no its just a slow day.

I am almost 100% confident that this is incorrect and they have no idea what is going on.
Ignored
This is why you trade currency futures.
 
 
  • Post #21,108
  • Quote
  • Jun 15, 2011 1:04pm Jun 15, 2011 1:04pm
  •  Beljevina
  • Joined May 2009 | Status: Trading, Not Posting | 2,130 Posts
Quoting bauerjj10
Disliked
I spoke with there customer support and they have no clue. The guy told me that the volume is based off of ticks...*DUH* and that the charting program will produce the volume based on the tick data. So then I told him that their data feed must not be accurately providing tick data and he said no its just a slow day.

I am almost 100% confident that this is incorrect and they have no idea what is going on.
Ignored
The biggest problem with calling any help desk is that 1) they don't know the answers so 2) they make stuff up because 3) they want you to get off the phone and go away. That's why I don't call helpdesks, and strive to find answers myself and learn how things work. Don't even dream of asking them who their liquidity provider is ...

Of MT4 demo accounts, I have found FxPro to be have fairly good with relational difference volume, with high tick counts. FXCM MT4 wasn't too bad nor was Oanda from what I recall. But Sonofsin5 is right: I use MT4 (citibank) MT4 volume in conjunction with futures, which are centralized.

There are brokers that you can open an account with $500, have all futures feeds, use NinjaTrader (free version), and, if they have currency mini-futures, they require $100 margin, so in theory a good trader could make some money, although the risk is fairly high. Or, you could just keep the account in simulation mode, and when you're done, withdraw your money; in theory it beats paying for a separate datafeed, which are minimum $100/month. I think MBTrading could give you both futures and spot, receive it all in Ninjatrader, and perhaps even at a lesser fee.
 
 
  • Post #21,109
  • Quote
  • Jun 15, 2011 1:08pm Jun 15, 2011 1:08pm
  •  pipon
  • | Joined Mar 2011 | Status: Member | 190 Posts
What a day....
Looking back I can see some ND bars on 15M and 30M but not on a trigger...
Did any of the more experienced trader took a piece of todays action and can show where and why ?
 
 
  • Post #21,110
  • Quote
  • Jun 15, 2011 2:22pm Jun 15, 2011 2:22pm
  •  NaughtyPip
  • Joined Aug 2010 | Status: Member | 1,282 Posts
Quoting pipon
Disliked
What a day....
Looking back I can see some ND bars on 15M and 30M but not on a trigger...
Did any of the more experienced trader took a piece of todays action and can show where and why ?
Ignored

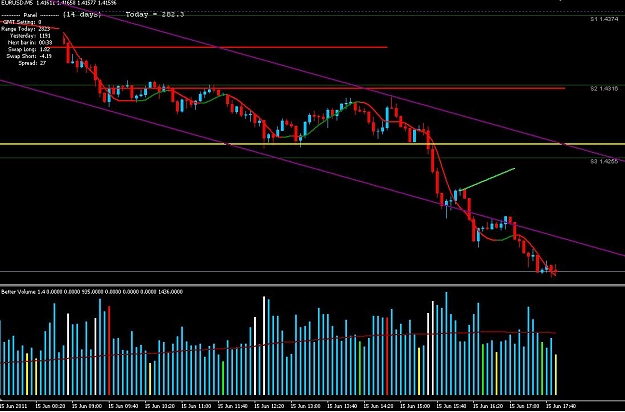
Im by no means an expert but since I'm making a conscious effort to upload charts more often I thought id show you my trade.

The problem with today was there was alot of downside momentum, so in this market condition price isnt as likely to return to triggers as much as it would on a normal day.

The yellow line on the chart is where price was ranging for a while, on the 1 hr it formed 3 pin bars, or reverse upthrusts if you like. Volume was highish, and this is where majority of the herd would have bought I think. There was an entry short in this area before the break out but I didnt trade it because it wasnt clear enough for me.

So we get the break out and I wait for an hourly close below this yellow line to give me more assurance that we arent seeing some sort of shakeout/ trap move.

Now trend has been down all day, so I am looking only for shorts. 3 candles before the one I marked with a green line looks like stopping volume. So i wait for reaction.

Still I am looking for only shorts, because strength in a down trend is usually shortlived and will only knock the market sideways unless there has been significant strength building up over time (accumulation).

Next bar is and up bar on lower volume, and the next bar even less volume (no buying pressure) and the one I have marked a nice no demand. At this point the hourly bar has now closed and I have some more assurance that this is a valid down move.

I can see the volume falling off as price retraces, so I am basically just waiting for the first bear bar to breach a bull candle. And there is my entry.

This was also a setup on the 15 mins.

Critique appreciated.
Attached Image (click to enlarge)
Click to Enlarge

Name: bottom.JPG
Size: 111 KB
 
 
  • Post #21,111
  • Quote
  • Jun 15, 2011 4:13pm Jun 15, 2011 4:13pm
  •  KinsaleForex
  • Joined Oct 2010 | Status: Looking at a few more charts... | 1,195 Posts
Quoting NaughtyPip
Disliked
Im by no means an expert but since I'm making a conscious effort to upload charts more often I thought id show you my trade.

The problem with today was there was alot of downside momentum, so in this market condition price isnt as likely to return to triggers as much as it would on a normal day.

The yellow line on the chart is where price was ranging for a while, on the 1 hr it formed 3 pin bars, or reverse upthrusts if you like. Volume was highish, and this is where majority of the herd would have bought I think. There was an entry short...
Ignored
Seeing as you replied to mine earlier in the week, i shall reciprocate. I'm gutted I missed most of the action today as I was working this morning. This looks like a nice trade to me, you're right about the trigger numbers. It didn't stick around to test them at all today. So we had to stick with 'proper' VSA to benefit. Like you said, it was just a pathetic attempt at a retrace ending in a nice narrow spread ND bar. Great little short and I hope you rode it all the way down!
 
 
  • Post #21,112
  • Quote
  • Jun 15, 2011 4:30pm Jun 15, 2011 4:30pm
  •  KinsaleForex
  • Joined Oct 2010 | Status: Looking at a few more charts... | 1,195 Posts
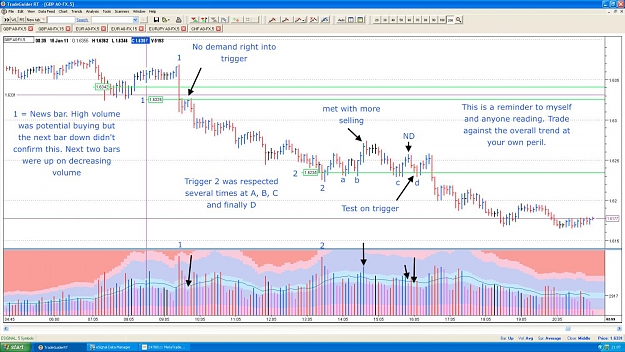
On the left of the chart you can see a nice short set up Just after the news this morning. I did see this before leaving for work but hesitated. Kicking myself now!

The main area I wish to talk about is Trigger 2 and D. At D we see the trigger again respected and what looks like a perfect test. I was around long enough to see this phase unfold and remember thinking "If i was home now, i would definitely buy that". My thought process was that it had respected the trigger a few times and this would be the test and bounce that was needed to go long. Looking at it now this wasn't a good decision.

We are in a down trend. No two ways about it.

The initial reaction from Trigger bar 2 wasn't great. Pushing up on no demand and being met with sellers. Bounced at A and this time didn't make it past the previous high. So we bounce at B again, this time pushing up and making a higher high. Met with even more sellers, one of the highest volume bars of the day. Here we go again, another bounce at C ending in a ND. We weren't going to be going anywhere long any time soon.

If you had taken the test you might have got away with a BE if you were quick to move stops, but in all likelihood it wouldn't have been a favourable outcome.

More of a way to drill this into myself but hopefully it helps someone else as well.
Attached Image (click to enlarge)
Click to Enlarge

Name: GU 5min.jpg
Size: 189 KB
 
 
  • Post #21,113
  • Quote
  • Jun 15, 2011 5:14pm Jun 15, 2011 5:14pm
  •  pipon
  • | Joined Mar 2011 | Status: Member | 190 Posts
Quoting NaughtyPip
Disliked
Im by no means an expert b...
Now trend has been down all day, so I am looking only for shorts...
Ignored
Thanks for the chart, good trade !
I think I have a mental problem - when I see that the daily move is allready a drop of more then 180 pips, I can't get myself to look fo more short trades. there where no long setups today, so I just didnot trade, but If I was open to the idea that it can still drop, then an extra 60-70 pips would be easy...

need to work on that...
 
 
  • Post #21,114
  • Quote
  • Jun 15, 2011 6:21pm Jun 15, 2011 6:21pm
  •  Lowell83
  • | Joined May 2011 | Status: Member | 43 Posts
Quoting KinsaleForex
Disliked
On the left of the chart you can see a nice short set up Just after the news this morning. I did see this before leaving for work but hesitated. Kicking myself now!

The main area I wish to talk about is Trigger 2 and D. At D we see the trigger again respected and what looks like a perfect test. I was around long enough to see this phase unfold and remember thinking "If i was home now, i would definitely buy that". My thought process was that it had respected the trigger a few times and this would be the test and bounce that was needed to go long....
Ignored
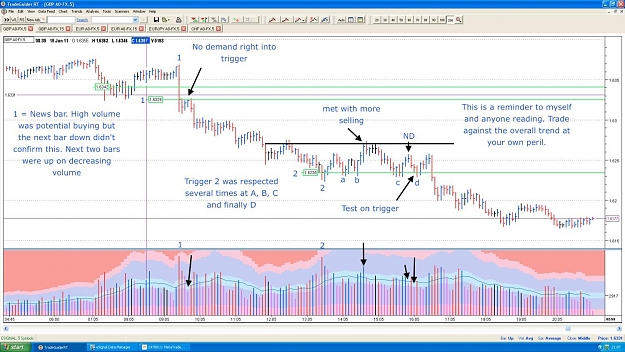
Excellent analysis as always Liam.

I think this is a great example of how high volume down bars are a potential sign of strength and need to be proven.

Me, personally, Id like that long black line to be broken/tested before I consider a long, but I consider myself a pretty conservative trader.

Thanks for the reminder
Attached Image (click to enlarge)
Click to Enlarge

Name: LiamGBP5min.jpg
Size: 318 KB
 
 
  • Post #21,115
  • Quote
  • Edited 8:19pm Jun 15, 2011 7:46pm | Edited 8:19pm
  •  pres78
  • Joined Sep 2010 | Status: I'm not here... or am I? | 3,999 Posts
So Oil was a nice VSA pair today (as it is most days and is basically all I have traded for quite some time now)... Disclaimer I in no way recommend trading Oil to anyone here as it is highly volitile, carries high margin requirements and requires higher SL even with the best set-ups...

I will take some set-ups after LO if a nice trend is running but prefer to wait until after NY open or even better after NYSE open. I have marked all 3 on the attached chart.

For the attached chart I focused on the post NYO leading into NYSE and the drop off after.

1. SC, next bar down on high volume and then an upbar... some buying but reaction was a push sideways. For safe trades we wait for PA to get back above hull and PAL and have the hull be blue.
2. No set-up yet but now we see an UT closing below the hull and on the PAL... SOW? We want a downbar to confirm and then a ND for entry... UT's often get tested if enough strength is present as happened here.
3. Still no long set-up on to get in long so we wait... Up, new high but look at the volume and spread... squat bar and a POSSIBLE SOW, hidden sellers or absorption... again we wait.
4. Downbar showing that some selling happened in that last upbar... Now this is also a two bar reversal and according to Gavin's new book the fact that the volume was higher on the upbar (bar 3) and the downbar (bar 4) made a higher high and closed on it's low this adds to the weakness.

So what we are starting to see here is that SM most likely started selling on that UT and we are seeing a trap move.

5. Weak UT... SOW
6. ND, tiny spread and the lowest volume in 8 bars... aggressive short entry as we are above the blue hull and PAL
7. No buying pressure, lowest volume in 10 bars... aggressive short entry 2 for same rasons as bar 6
8. Increased volume downbar (2nd highest of the day) closing off it's low... POSSIBLE SOS , hidden buyers or absorption. Bar 8 low was also right on the close of bar 1 (to the pip)... Trigger, Stopping volume? If we are short tighten stops and if not wait to see what happens next... We have closed below the highest volume UT bar # 2 but still have bar 1 buying as possible support...
9. Effort to rise, close below bar 8 close, next bar down... SOW
10. Effort to rise
11. ND / no buying pressure with the close right on the bar 8 trigger... bright yellow on the old better volume, lowest volume in 21 bars... OK SM if you want to make it that obvious...

This is the best short entry based on all the stars aligning... hull red and sloping down, PA below the hull and PAL, ND into trigger with SOW in the background etc...

If you were riding the tarde watching for bars to close back above the hull and PAL you would have gotten out around 95.40 however that highest volume downbar which created the days low, clsoing off it's low with the next bar up was a clear VSA SOS and a good time to get out around 95.00.
Attached Image (click to enlarge)
Click to Enlarge

Name: oil.jpg
Size: 133 KB
Today's zone = Tomorrow's opportunity!
 
 
  • Post #21,116
  • Quote
  • Jun 15, 2011 8:31pm Jun 15, 2011 8:31pm
  •  Intel
  • Joined Dec 2009 | Status: Member | 2,367 Posts
Quoting pres78
Disliked
....... Now this is also a two bar reversal and according to Gavin's new book the fact that the volume was higher on the upbar (bar 3) and the downbar (bar 4) made a higher high and closed on it's low this adds to the weakness.......
Ignored
I'm glad that Gavin agrees about the 2 bar reversal volumes. I've been telling people that for ages.......I'm sure people thought I was making it up!!!!
 
 
  • Post #21,117
  • Quote
  • Jun 15, 2011 8:35pm Jun 15, 2011 8:35pm
  •  J00
  • | Joined Jun 2011 | Status: Junior Member | 2 Posts
Quoting pres78
Disliked
So Oil was a nice VSA pair today
Ignored
Fantastic charting.

I too tend to trend into the more volatiles, (silver).

I find that because the moves are so aggressive, I really need to understand the 'background'.

I tend to implemement quite alot of Fib and S/R into my analysis; and enter trades in areas of 'confluence'

The best advice I have read so far to date on this topic is that the signals and signs that we are waiting to see, may actually occur over 3-4 bars.

I also believe that there may also be ND/NS 'days'.

I will be able to read the charts like a book, it's just a matter of practice and study.
 
 
  • Post #21,118
  • Quote
  • Jun 15, 2011 8:36pm Jun 15, 2011 8:36pm
  •  pres78
  • Joined Sep 2010 | Status: I'm not here... or am I? | 3,999 Posts
Quoting Intel
Disliked
I'm glad that Gavin agrees about the 2 bar reversal volumes. I've been telling people that for ages.......I'm sure people thought I was making it up!!!!
Ignored
Yes that was always a weird one for me as I have read so many times that the volume on the second bar should be higher and if it was a top reversal you in no way want the downbar to make a higher high...

This all made not much sense since SM sells upbars why wouldn't you want to see that upbar as higher volume... shows SM activity and if the next bar drops on lower volume and has made a higher high (testing of sorts) then that shows SM has been selling and of course adds to the SOW... (or SOS if a bottom reversal)

I am not one to take much of what Gavin writes as having any value to me since it is all geared to sell TG... this particular bar pattern however has stuck with me since reading it...
Today's zone = Tomorrow's opportunity!
 
 
  • Post #21,119
  • Quote
  • Jun 15, 2011 9:05pm Jun 15, 2011 9:05pm
  •  pres78
  • Joined Sep 2010 | Status: I'm not here... or am I? | 3,999 Posts
Quoting J00
Disliked
Fantastic charting.

I too tend to trend into the more volatiles, (silver).

I find that because the moves are so aggressive, I really need to understand the 'background'.

I tend to implemement quite alot of Fib and S/R into my analysis; and enter trades in areas of 'confluence'

The best advice I have read so far to date on this topic is that the signals and signs that we are waiting to see, may actually occur over 3-4 bars.

I also believe that there may also be ND/NS 'days'.

I will be able to read the charts like a book, it's just...
Ignored
I also rely on S/R, DPP, previous day H/L etc... and use fibs extensively for tracking movements retraces etc...

SM can be tracked using VSA... any pair, any TF... chart time, chart time and a little more chart time for good measure.

Never take a trade you don't understand and spend as much time each week working backwards from where SM took the price figuring out how and when you could have gotten in that not only made sense but met with your trading plan.
Today's zone = Tomorrow's opportunity!
 
 
  • Post #21,120
  • Quote
  • Jun 15, 2011 9:25pm Jun 15, 2011 9:25pm
  •  pipon
  • | Joined Mar 2011 | Status: Member | 190 Posts
Quoting pres78
Disliked
So Oil was a nice VSA pair today...
Ignored
Thank you for a great analysis !! Im learing alot from you.
I hope the day that I will have the knowledge/guts to upload my charts and help others is nearing...
 
 
  • Interactive Trading
  • /
  • vsa with Malcolm
  • Reply to Thread
    • 1 10541055Page 105610571058 1806
    • 1 Page 1056 1806
2 traders viewing now
  • More
Top of Page
  • Facebook
  • Twitter
About FF
  • Mission
  • Products
  • User Guide
  • Media Kit
  • Blog
  • Contact
FF Products
  • Forums
  • Trades
  • Calendar
  • News
  • Market
  • Brokers
  • Trade Explorer
FF Website
  • Homepage
  • Search
  • Members
  • Report a Bug
Follow FF
  • Facebook
  • Twitter

FF Sister Sites:

  • Metals Mine
  • Energy EXCH
  • Crypto Craft

Forex Factory® is a brand of Fair Economy, Inc.

Terms of Service / ©2023