DislikedAsaf,
Can you give us an example of all the trader statistics you give out ?
Will I be able to see a track record that shows the amount of pips that are made for a specific currency pair ? average daily pips,etc..Ignored
We have two places that we show performance in Currensee and we show this slightly different as they represent different usages.
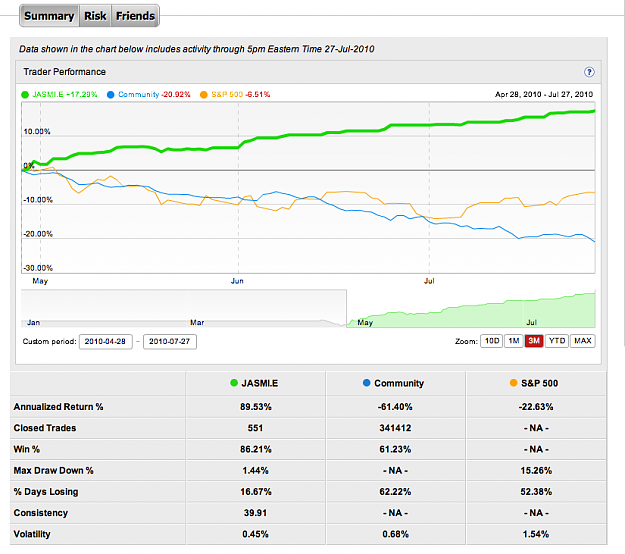
The first place in on everyone's profile, if they chose to share it.
We calculate the following for Performance:
Annualized return
Number of closed trades
Win%
Max Draw Down%
% Days losing
Consistency - this is measuring how well the trader sticks to his strategy
Volatility - this is the daily standard deviation and is a good indication of risk
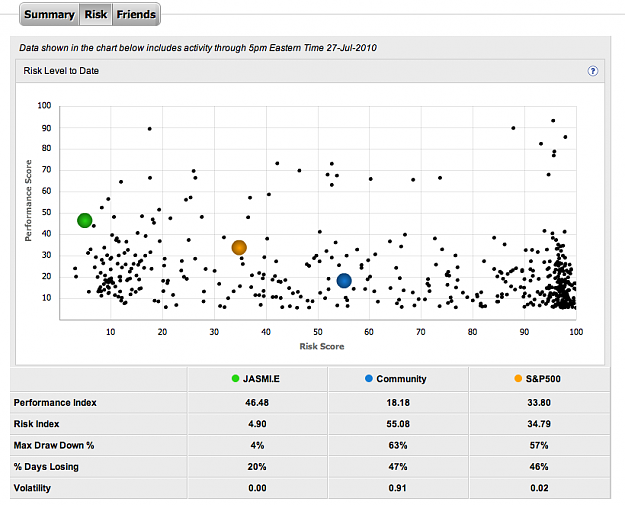
We also calculate three proprietary metrics:
Performance index - A complex calculation that takes into account the Annualized return, Consistency and History trading
Risk Index - A complex calculation that takes into account the Max DD%, Volatility and % Days losing.
TAI (Trader Authority Index) - A calculation that takes into account the Performance Index and the Risk Index.
Attached are two views from the profiles - the first is a performance view and the second is a risk view where we grade traders on a risk reward graph and compare them to other traders and to the S&P as an investment.
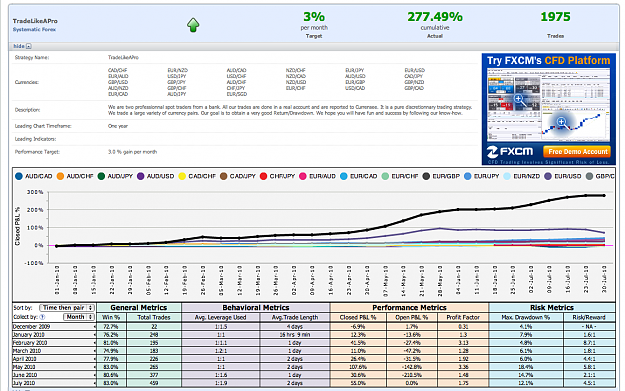
The second place we show performance is on strategies and here we show the following parameters and show different graphs and slices based on time and currency pair traded. Attached is a screenshot from the strategy section.
We calculate:
Win%
Number of trades
Avg leverage being used - (How much leverage the trader is using)
Avg Trade Length - how long are the trades open
Closed P&L
Open P&L
Profit factor - Ratio of the dollars won to dollars lost
Max DrawDown%
Risk/Reward - Ratio between the P&L and the MAx DD%.
-- Asaf.
Attached Image(s) (click to enlarge)