• Home
  • Forums
  • Trades
  • News
  • Calendar
  • Market
  • Brokers
  • Login
  • Join
  • User/Email: Password:
  • 10:42pm
Menu
  • Forums
  • Trades
  • News
  • Calendar
  • Market
  • Brokers
  • Login
  • Join
  • 10:42pm
Sister Sites
  • Metals Mine
  • Energy EXCH
  • Crypto Craft

Options

Bookmark Thread

First Page First Unread Last Page Last Post

Print Thread

Similar Threads

Trading Cartoons and Pics 2,827 replies

Take pics from different TF at same time... 12 replies

The pics are missing in the article 0 replies

A project i'm thinking on. Feedback welcome. 4 replies

  • Trading Journals
  • /
  • Reply to Thread
  • Subscribe
  • 158
Attachments: Piggleop's Pics of my trades - feedback welcome
Exit Attachments
Tags: Piggleop's Pics of my trades - feedback welcome
Cancel

Piggleop's Pics of my trades - feedback welcome

  • Last Post
  •  
  • Page 1 23 4
  • Page 1 23 4
  •  
  • Post #1
  • Quote
  • First Post: Edited Jan 31, 2010 8:27pm Jan 26, 2010 2:47pm | Edited Jan 31, 2010 8:27pm
  •  Piggleop
  • | Joined Jan 2010 | Status: Member | 92 Posts
Hey, I'm new to FOREX and I thought this would be a fun experience. I'm going to start tracking my trades by saving pics, explaining if im long or shot and why, and anyone who wants can feel free to give CONSTRUCTIVE criticism. It's fine to disagree w/ me or even rail on me a bit, just don't be rude about it please.

1. I'm going to be using hourly and 15 minute charts for my trades

2. I'll post my thoughts, write things on the graph etc.

3. Nothing fancy...

4. Many trades I'm going to take in this demo account are going to be bad trades...I'm just trying to get a better understanding of the market so I will be doing some stupid things but thats fine w me


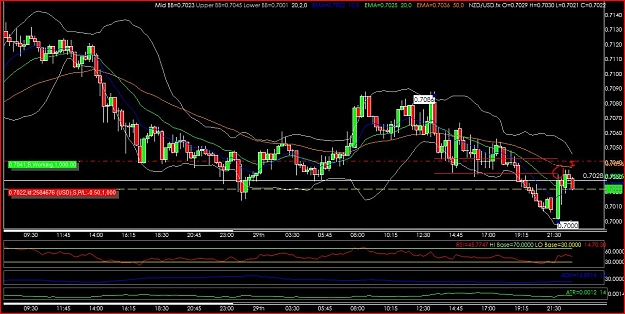
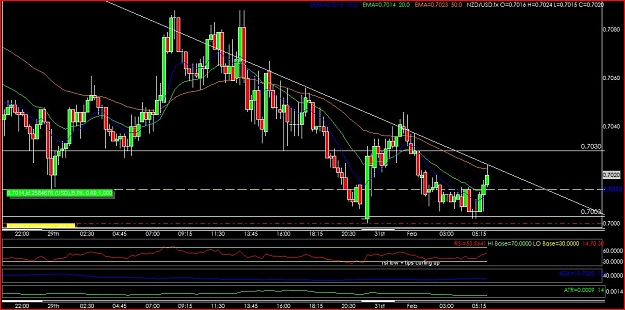
nzd/usd - short
So... the one hour chart and hte 15 minute chart are attached
Attached Image (click to enlarge)
Click to Enlarge

Name: jan26 c.jpg
Size: 109 KB

Attached Image (click to enlarge)
Click to Enlarge

Name: jan26 d.jpg
Size: 110 KB


Hourly chart - The overall trend is downwards and price retraces to the 50% fibonacci level, also a resistance level. Rally was strong, so this could be good or bad: good because overbought, bad because that shows strength
15 min chart - entry is based on evening star pattern and rsi close to overbought.

In retrospect I think I should have made the stop tighter: after-all, if the resistance breaks it means I was probably wrong about the downtrend continuing.

edit: the fibonacci lines are those little red ones you can see right near the entry

edit: I'm actually moving the stop loss closer to the entry point because of the reason above...don't usually do that but it was kind of a dumb stop in the first place. I'll still give room for some scary moves, but I'm tightening the stop:
  • Post #2
  • Quote
  • Jan 26, 2010 3:07pm Jan 26, 2010 3:07pm
  •  Piggleop
  • | Joined Jan 2010 | Status: Member | 92 Posts
Considering going long here...if I do I'll explain my reasoning
Attached Image (click to enlarge)
Click to Enlarge

Name: jan26 e.jpg
Size: 99 KB


The main concern I have here is that the bear stick a few hours back was a serious move, and some other things. If I do go long sometime soon, I'm going to be able to have a relatively tight stop fortunately because if it breaks through the trend line I think I should get out
 
 
  • Post #3
  • Quote
  • Edited 3:32pm Jan 26, 2010 3:20pm | Edited 3:32pm
  •  Piggleop
  • | Joined Jan 2010 | Status: Member | 92 Posts
Alright, I could use advice on this one guys, it's the one above updated and w a 15 minute chart...
Attached Image (click to enlarge)
Click to Enlarge

Name: jan26 f.jpg
Size: 103 KB

Attached Image (click to enlarge)
Click to Enlarge

Name: jan26 g.jpg
Size: 106 KB


I don't think I'm going to go long here yet, opinions?

edit: got in a little late out of indecision, but it seems to have a strong trend upwards (might regret this lol but its a demo account so oh well). new charts in a second
 
 
  • Post #4
  • Quote
  • Jan 26, 2010 3:36pm Jan 26, 2010 3:36pm
  •  Piggleop
  • | Joined Jan 2010 | Status: Member | 92 Posts
K here are the charts for USD/CAD... I think i got in a bit late but currently it's just a demo account with this stuff so I guess I might have to learn a free lesson.

Attached Image (click to enlarge)
Click to Enlarge

Name: jan26 h.jpg
Size: 108 KB


Attached Image (click to enlarge)
Click to Enlarge

Name: jan26 i.jpg
Size: 110 KB
 
 
  • Post #5
  • Quote
  • Jan 26, 2010 7:36pm Jan 26, 2010 7:36pm
  •  Piggleop
  • | Joined Jan 2010 | Status: Member | 92 Posts
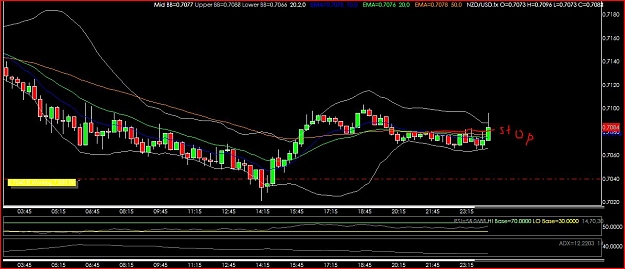
NZD/USD - I get stopped out for a small gain after moving the stop upwards. The big green candle hit resistance about where I bought in then dropped, maybe too tight a stop I dont know?

Attached Image (click to enlarge)
Click to Enlarge

Name: jan26 3.JPG
Size: 108 KB
U

USD/CAD - still holding...moved stop up though

Attached Image (click to enlarge)
Click to Enlarge

Name: jan26 1.JPG
Size: 121 KB


Attached Image (click to enlarge)
Click to Enlarge

Name: jan26 2.JPG
Size: 121 KB


new stop is below the consolidation
 
 
  • Post #6
  • Quote
  • Jan 27, 2010 9:30am Jan 27, 2010 9:30am
  •  jzw
  • | Joined Jun 2009 | Status: Member | 147 Posts
Piggleop - why don't you write your entry price, stop and target (if you have one) in the post, rather than scrawl it on the chart (does your charting package not have a text tool?).

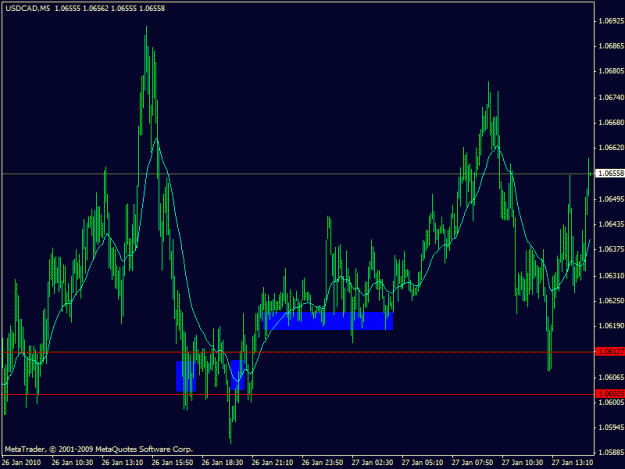
Looking at CAD - I can see 3 potential areas for long entries, if you are biased to go long.

1 - buy on the drop into support in the 1.0600-1.06010 region without waiting for confirmation. Risk/reward can be great here but sometimes support is not going to hold so you must commit yourself to a stop level and get out if that is breached.
2 - buy immediately after the push down to 1.059 is recovered. This looks like the best entry but sometimes the market is going to bounce without tipping you off so you will miss some trades.
3 - buy over 1.0620 after getting over minor resistance. Wait for confirmation that support has held before buying. This is the lowest risk entry.

They all make some sense - its up to you to decide how aggressively you want to trade and to structure your stop/target appropriately.
Attached Image (click to enlarge)
Click to Enlarge

Name: cad.gif
Size: 19 KB
 
 
  • Post #7
  • Quote
  • Edited 10:03pm Jan 28, 2010 7:34pm | Edited 10:03pm
  •  Piggleop
  • | Joined Jan 2010 | Status: Member | 92 Posts
Ok, made a new trade

Attached Image (click to enlarge)
Click to Enlarge

Name: jan28 2.JPG
Size: 146 KB


Attached Image (click to enlarge)
Click to Enlarge

Name: jan28 3.JPG
Size: 138 KB


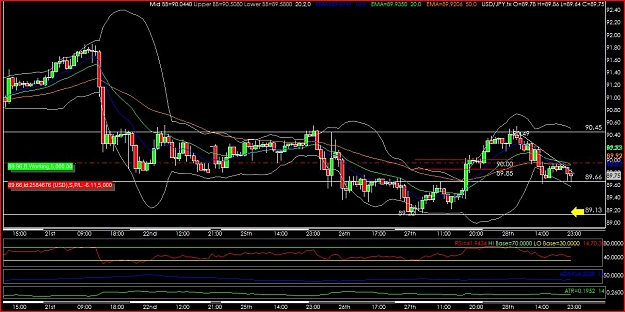
adx is at 27, trend is downwards, I'm thinking the support will be broken soon after that big bear candle. Target is at a support level and 3:1 ratio basically. Will post results of trade soon.

edit: shorted mainly because of the 50/8 ma crossover, going to see what happens here more than making an actual good trade

Attached Image (click to enlarge)
Click to Enlarge

Name: jan28 8.jpg
Size: 125 KB


and i get stopped out
 
 
  • Post #8
  • Quote
  • Edited Jan 29, 2010 12:47am Jan 28, 2010 7:42pm | Edited Jan 29, 2010 12:47am
  •  Piggleop
  • | Joined Jan 2010 | Status: Member | 92 Posts
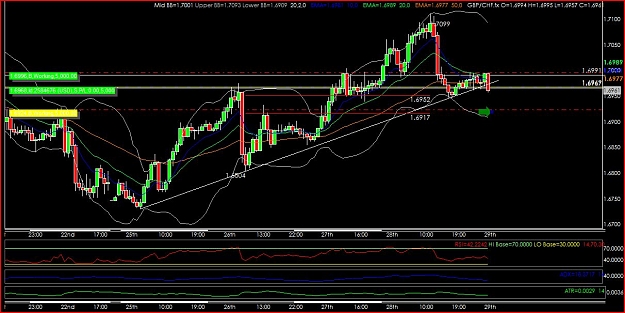
Second trade I went long in:

Attached Image (click to enlarge)
Click to Enlarge

Name: jan28 4.JPG
Size: 141 KB


Attached Image (click to enlarge)
Click to Enlarge

Name: jan28 5.JPG
Size: 141 KB


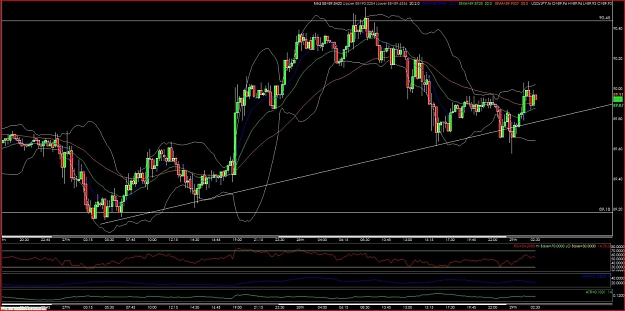
overall trend is up, significant trend line below, buying on the dip w RSI dropping low. Stop loss is below trend line and minor support

the new chart about 1.5 hours later:

[IMG]file:///C:/Users/Owner/AppData/Local/Temp/moz-screenshot.png[/IMG]
Attached Image (click to enlarge)
Click to Enlarge

Name: JAN28 6.JPG
Size: 132 KB


It's in a trading range right now, but if it breaks up I'm going to hold it. If it goes down from the trading range, I think I'm going to get out.

Notice the trendline is still holding strong, the buy point is near fibonacci 38.2, and the 50-day MA just moved under the trade

So here I tried to buy into the uptrend, but the huge swing down, rather than trickling down to the fib levels, has me worried. Too much

momentum, guess I'll se what happens.

[IMG]file:///C:/Users/Owner/AppData/Local/Temp/moz-screenshot-1.png[/IMG]
Attached Image (click to enlarge)
Click to Enlarge

Name: jan28 dd.JPG
Size: 132 KB


trend line breaks by a long bearish bar, reversing position and going short

Attached Image (click to enlarge)
Click to Enlarge

Name: bong 4.JPG
Size: 146 KB
 
 
  • Post #9
  • Quote
  • Edited 11:24pm Jan 28, 2010 10:17pm | Edited 11:24pm
  •  Piggleop
  • | Joined Jan 2010 | Status: Member | 92 Posts
Attached Image (click to enlarge)
Click to Enlarge

Name: jan28 e.jpg
Size: 129 KB


short --> heavy break through trendline, want to see how the market responds to this. Maybe I even drew the tl wrong...who knows? 50 day ema now above price. I'm guessing it'll come back up then go back down again, already getting oversold on the 15 minute chart.

Attached Image (click to enlarge)
Click to Enlarge

Name: jan28 11.jpg
Size: 118 KB


update: ya i think i got hte trend line wrong, not to mention I was trying to be a contrarian instead of going w the trend.

Attached Image (click to enlarge)
Click to Enlarge

Name: jan28 10.jpg
Size: 124 KB


Attached Image (click to enlarge)
Click to Enlarge

Name: jan28 Bb.JPG
Size: 128 KB


Ya hit the trendline w perfect morning star/hammer/doji. Looks like I fought the trend wrong
Attached Image (click to enlarge)
Click to Enlarge

Name: jan28 Aa.JPG
Size: 133 KB
 
 
  • Post #10
  • Quote
  • Edited Jan 29, 2010 12:42am Jan 28, 2010 10:24pm | Edited Jan 29, 2010 12:42am
  •  Piggleop
  • | Joined Jan 2010 | Status: Member | 92 Posts
short - hitting new resistance above, overall downtrend. Stop loss is placed above 2nd resistance level.

Attached Image (click to enlarge)
Click to Enlarge

Name: jan28 b.jpg
Size: 125 KB


Attached Image (click to enlarge)
Click to Enlarge

Name: jan28 c.jpg
Size: 117 KB


again, I'm trying to buy into the downtrend off a bounce up, want to watch what happens because there was def a morning star formation in the buy side...

[IMG]file:///C:/Users/Owner/AppData/Local/Temp/moz-screenshot-2.png[/IMG]
Attached Image (click to enlarge)
Click to Enlarge

Name: jan28 ee.JPG
Size: 134 KB


Here, I think I'm being impatient in my trades. True the 15 minute chart had a good pullback to resistance/fibonacci 38, but looking at the hour chart the rsi is already really low, so trend trading isnt as valid here.

Attached Image (click to enlarge)
Click to Enlarge

Name: jan28 ff.JPG
Size: 134 KB


Here I'm not sure if I should take profits: the move was relatively short but im encountering substantial support below... gona hold it just to see what happens.

Attached Image (click to enlarge)
Click to Enlarge

Name: bong 2.JPG
Size: 138 KB


ya hit the support and bounced up, cut my trailing stop real quick

Attached Image (click to enlarge)
Click to Enlarge

Name: bong 3.JPG
Size: 127 KB
 
 
  • Post #11
  • Quote
  • Edited 7:03pm Jan 31, 2010 6:19pm | Edited 7:03pm
  •  Piggleop
  • | Joined Jan 2010 | Status: Member | 92 Posts
Alright, I have 15000 credits and I'm going to risk 5% per trade:

nzd/usd - short

15000x.05= $750
1 lot

Attached Image (click to enlarge)
Click to Enlarge

Name: jan31 b.JPG
Size: 146 KB


Attached Image (click to enlarge)
Click to Enlarge

Name: jan31 c.JPG
Size: 145 KB


already testing the fibonacci retracement, stop loss placed just above 50-day ema...I shorted this to see what happens after such a significant bullish eunglufing move...normally i'd go long and probably should have. However, it is hitting 38 percent fibonacci and the currency pair is in an overall downtrend...also note the support-turned resistance. Its common to see a retracement before a decline

ultimately this one comes down to the bullish buying recently vs the resistance and downtrend its up against.

knocked out of stop with the uptrend, im going to post htis chart in a few hours to see if the bull reversal went throuhg.

In my eyes it was a battle between large bull strength in that big candle and just a retesting of the support-turned resistance level
 
 
  • Post #12
  • Quote
  • Edited Feb 1, 2010 12:20am Jan 31, 2010 6:36pm | Edited Feb 1, 2010 12:20am
  •  Piggleop
  • | Joined Jan 2010 | Status: Member | 92 Posts
gbp/usd - long

Attached Image (click to enlarge)
Click to Enlarge

Name: jan31 d.JPG
Size: 142 KB


Attached Image (click to enlarge)
Click to Enlarge

Name: jan31 e.JPG
Size: 125 KB


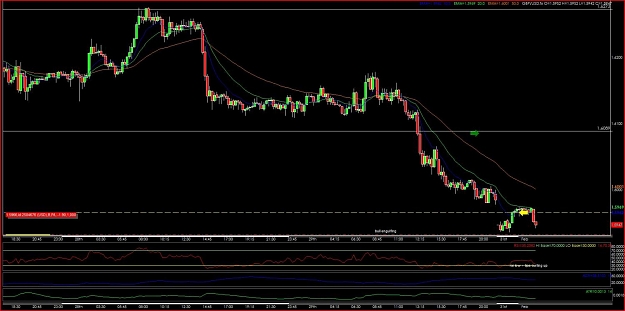
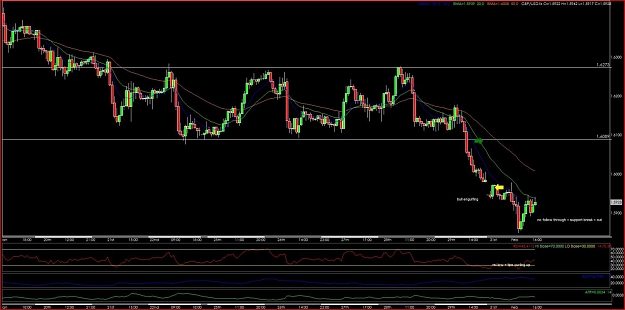
Again, i've read a lot about not fighting the trend (and htis certainly is me trying to see a reversal and fighting the trend, rather than buying a pullback from the trend direction) so I want to go with bullish engulfing vs a steep downswing to see what happens. This is really a weird situation in forex, dont see gaps very often and I normally wouldnt take the trade, but just want to see what happens it is a demo account after all

edit: my guess is it will consolidate for a bit ...

edit: point of this trade is (hopefully) to show that this formation doesn't equal a reversal always, but just a stall in the overall trend.

update: yeah it's just been consolidating... reversals should show immediate strength to validate them but I'm going to hold on to it for education's sake.

Attached Image (click to enlarge)
Click to Enlarge

Name: jan31 k.jpg
Size: 112 KB


I'm going to continue holding onto this because I want to see if support will hold and, more importantly, if the rsi is working here when its extremely oversold. aka a bounce back up. But really, I would exit because there's no reason to think it's going up after the original reason for getting in was rsi + bullish engulfing (see above charts). This means there should have been a follow throuhg but all there was is a drop down so it's like gambling if i continue. But I'm going to hold it to see what happens.

Attached Image (click to enlarge)
Click to Enlarge

Name: z 5.jpg
Size: 112 KB


closing the trade as it goes nowhere
 
 
  • Post #13
  • Quote
  • Edited 9:31pm Jan 31, 2010 7:01pm | Edited 9:31pm
  •  Piggleop
  • | Joined Jan 2010 | Status: Member | 92 Posts
USD/CHF - SHORT

Here are my thoughts on this one: wayyy overbought w harami/ possible engulfing pattern going downward.

stop loss above 15 minute resistance

I think the downside is I'm not timing well on the 15 minute chart, with this trade and otehrs so something to work on.

Attached Image (click to enlarge)
Click to Enlarge

Name: JAN31 F.JPG
Size: 124 KB


Attached Image (click to enlarge)
Click to Enlarge

Name: jan31 g.JPG
Size: 129 KB


edit: cool looks like i can see a flag or triangle developing on the 15-minute chart, could have just been a big run up and consolidation. Normally formations like this are continuation but the stock is wayyy overbought so we'll see.

notice how lately ive been getting creamed trying to identify reversals, notice also that the adx is super high for this currency pair meaning its got a great uptrend. Gona keep posting these ones to get a feel for reversals vs trends

Attached Image (click to enlarge)
Click to Enlarge

Name: jan31 i.JPG
Size: 123 KB


look at this 15 minute chart and notice that while it seemed like atriangle was forming, it could also be a box/flag so the break through the upwards slanting triangle isnt always gonig to be valid. Got to watch the patterns and consider other possiblities every time.

Attached Image (click to enlarge)
Click to Enlarge

Name: jan31 1.jpg
Size: 121 KB


i think i should have expected consolidation and thats what it's doing so far....

Attached Image (click to enlarge)
Click to Enlarge

Name: z 4.jpg
Size: 111 KB


and im stopped out as the upper resistance gets broken...review comments before to reach conclusion i probably shouldnt have been involved in a continuation pattern:

Attached Image (click to enlarge)
Click to Enlarge

Name: z 12.jpg
Size: 113 KB
 
 
  • Post #14
  • Quote
  • Edited Feb 1, 2010 12:18am Jan 31, 2010 7:13pm | Edited Feb 1, 2010 12:18am
  •  Piggleop
  • | Joined Jan 2010 | Status: Member | 92 Posts
eur/usd

Attached Image (click to enlarge)
Click to Enlarge

Name: jan31 j.JPG
Size: 113 KB


this is an example of going w the trend. Im going to wait for a retracement (RSI trendline etc will indicate it) then short the bounce off the tl and see what happens!


so now the situation is this: if it breaks down beyond this support anymore I'm going to short. advantages: overall downtrend + breakout down = high probabillity
disadvantage: rsi is already oversold pretty much so how much can it really go?

Attached Image (click to enlarge)
Click to Enlarge

Name: y2.JPG
Size: 125 KB


Attached Image (click to enlarge)
Click to Enlarge

Name: z 6.jpg
Size: 102 KB


ok, so support is broken (although rsi is close to oversold anyways) im going in... this is based on the 15 minute chart and less the hourly chart because the hourly chart isn't showing a significant move. Based on 15 minute chart, I expect it might consolidate a bit but i think it's going down so im in...

Attached Image (click to enlarge)
Click to Enlarge

Name: z 8.jpg
Size: 123 KB


Attached Image (click to enlarge)
Click to Enlarge

Name: z 9.jpg
Size: 123 KB


On hourly chart i notice that there isnt a strong penetration to identify a break of the support level...still in it but want to see what happens next...

Attached Image (click to enlarge)
Click to Enlarge

Name: z 11.jpg
Size: 116 KB


important note: the rsi is very low here so going short might just mean consolidation, even in the face of a big downtrend that it's currently experiencing.

ya i get stopped out, but have no problem w this trade seeing as the support was continually being tested, and by some measures was already broken:

Attached Image (click to enlarge)
Click to Enlarge

Name: y2.JPG
Size: 125 KB
 
 
  • Post #15
  • Quote
  • Edited Feb 1, 2010 12:13am Jan 31, 2010 7:56pm | Edited Feb 1, 2010 12:13am
  •  Piggleop
  • | Joined Jan 2010 | Status: Member | 92 Posts
NZD/USD

Attached Image (click to enlarge)
Click to Enlarge

Name: z 1.jpg
Size: 109 KB


looking for candles + trendline to confirm a break down after this rally, already broke through fibonaccis though...

Attached Image (click to enlarge)
Click to Enlarge

Name: z 2.jpg
Size: 125 KB


Attached Image (click to enlarge)
Click to Enlarge

Name: z 3.jpg
Size: 113 KB


ok so here an evening star formed after a nice run up, I'm shorting to see this discrepancy: the hourly chart shows no reason to buy other than the fibonacci retracement, not even at the trend line. I think I keep doing this, trading too much on 15 minutes and just using the hourly to identify trend. Not a bad idea, but hourly should confirm moves too w rsi etc. so I want to see how this trade goes


here's the 15 minute: it dropped substantially so i moved my stop to about breakeven (no resistance levels so i just did it mechanically.


[IMG]file:///C:/Users/Owner/AppData/Local/Temp/moz-screenshot-3.png[/IMG]
Attached Image (click to enlarge)
Click to Enlarge

Name: z 7.jpg
Size: 127 KB


usd/nzd continues to drop... there is support close below so I'm wondering when to take profits. As an experiment I'm going to hold it and see if it reverses, maybe find a good trailing stop spot at s/r

Attached Image (click to enlarge)
Click to Enlarge

Name: z 10.jpg
Size: 125 KB


edit: i decide to place stop just above the 15 minute high of the big bear candle

edit: oversold territory, i take profits and will track later to see what happens.

Attached Image (click to enlarge)
Click to Enlarge

Name: y 1.JPG
Size: 121 KB


so thsoe are the results, looks like i could have made more profit on this. But just one sample so i'm not sure if i took profits too early. considering it wasa downtrend i could have let it get closer to the support, probably should have gotten out later and closer to the support level.
 
 
  • Post #16
  • Quote
  • Edited 12:41pm Feb 1, 2010 12:28am | Edited 12:41pm
  •  Piggleop
  • | Joined Jan 2010 | Status: Member | 92 Posts
gbp/usd

Attached Image (click to enlarge)
Click to Enlarge

Name: y 4.JPG
Size: 126 KB


interesting note here: i bought early based on bullish engulfing, but there was no follow up so no reason to think it would continue to rise...

edit: ya there should have been a followthrough --> look at chart for comments

Attached Image (click to enlarge)
Click to Enlarge

Name: a 5.jpg
Size: 110 KB
 
 
  • Post #17
  • Quote
  • Edited 12:38pm Feb 1, 2010 12:34am | Edited 12:38pm
  •  Piggleop
  • | Joined Jan 2010 | Status: Member | 92 Posts
nzd/usd

Attached Image (click to enlarge)
Click to Enlarge

Name: y 5.JPG
Size: 132 KB


not going to short this yet but i'm interested to see how a support line here works with little momentum coming down into it. Although then again, it looks like it might just be consolidating after the recent drop and could plummet again...we'll see

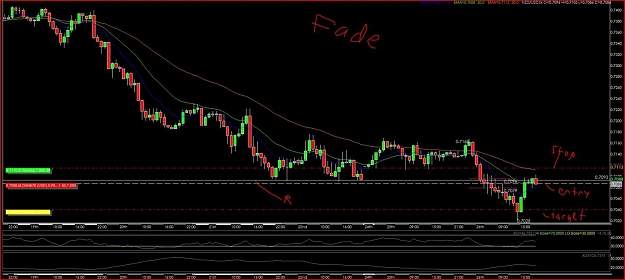
i'm now going to fade the support on this currency pair:

Attached Image (click to enlarge)
Click to Enlarge

Name: y 6.JPG
Size: 135 KB


Normally I wouldn't do this but I am actually looking to see if the downtrend will push the currency pair down more than if it was, say sideways or upward trending.

its a battle of rsi vs a downward trend

edit: not exactly accurate because since it's late at night, the fade is more likely to workl.

bout an hour later --> price has gone nowhere. Again, if i normally fade it i expect to see some confirmation (or if i think s is gona break), so....


update: Here's an interesting situation: price hits the trendline a nd bounces.
Do i get out now, assuming the trend line above won't be broken? (meaning i shouldnt have entered the trade in the first place). Or do I continue to hold it and hope it bounces over the trendline with momentum??

update: also at the fibonacci 50 percent retracement level this'll be interesting I thin kthe correct answer is dont do this in the first place, but get out now

Attached Image (click to enlarge)
Click to Enlarge

Name: y 7.JPG
Size: 137 KB


hourly chart - I went to sleep and dint pay attention to the market... look at chart to see the note but it was pretty clear support wouldn't be broken...should have put a stop loss lol but since its a demo account and i'm just experimenting its no big deal

Attached Image (click to enlarge)
Click to Enlarge

Name: a 4.jpg
Size: 116 KB
 
 
  • Post #18
  • Quote
  • Edited 12:34pm Feb 1, 2010 2:12am | Edited 12:34pm
  •  Piggleop
  • | Joined Jan 2010 | Status: Member | 92 Posts
eur/usd

Attached Image (click to enlarge)
Click to Enlarge

Name: x 1.JPG
Size: 127 KB


Attached Image (click to enlarge)
Click to Enlarge

Name: x 2.JPG
Size: 140 KB


sort of a new thing here, i've noticed there's a great downtrend that keepbouncing off the 20-day ema. So i decide to short in the trend direction, entering based on resistance and putting a stop loss slightly over it, so its a tight stop for htis situation.


shorting the eur/usd here...downtrend hitting trendline and failing to really penetrate it with (15 minute chart) lots of long legged attempts to but failing. Also at about fibonacci 50 and there's a bearish engulfing pattern right at the trend line. Stop is just fairly tight because I don't expect the trendline to be broken substantially. If it does break...I'd be getting out anyways.

Attached Image (click to enlarge)
Click to Enlarge

Name: a 2.jpg
Size: 120 KB


Attached Image (click to enlarge)
Click to Enlarge

Name: a 3.jpg
Size: 111 KB
 
 
  • Post #19
  • Quote
  • Edited 6:32pm Feb 1, 2010 12:48pm | Edited 6:32pm
  •  Piggleop
  • | Joined Jan 2010 | Status: Member | 92 Posts
gbp/jpy - short

Attached Image (click to enlarge)
Click to Enlarge

Name: a 6.jpg
Size: 126 KB


Attached Image (click to enlarge)
Click to Enlarge

Name: a 7.jpg
Size: 121 KB


at fibonacci retracement, overall i think the trend is down, sort of a trendline, way overbought....

stop loss is close again because if the trendline breaks i dont want to be involved. I like the r:r ratio in situations like these.

edit: stopped out as price goes nowhere.
 
 
  • Post #20
  • Quote
  • Feb 1, 2010 12:53pm Feb 1, 2010 12:53pm
  •  Piggleop
  • | Joined Jan 2010 | Status: Member | 92 Posts
usd/jpy - meh

ah man i cant believe i missed this, was a perfect reversal setup...

Attached Image (click to enlarge)
Click to Enlarge

Name: a 7.jpg
Size: 121 KB


Attached Image (click to enlarge)
Click to Enlarge

Name: a 8.jpg
Size: 117 KB


Could still short it, but i'll just wait to see what happens.

notie bearish enuglfing right at hte resistance level, way overbought, something of a shooting star on the hourly damn this would have been good.
 
 
  • Trading Journals
  • /
  • Piggleop's Pics of my trades - feedback welcome
  • Reply to Thread
    • Page 1 23 4
    • Page 1 23 4
0 traders viewing now
  • More
Top of Page
  • Facebook
  • Twitter
About FF
  • Mission
  • Products
  • User Guide
  • Media Kit
  • Blog
  • Contact
FF Products
  • Forums
  • Trades
  • Calendar
  • News
  • Market
  • Brokers
  • Trade Explorer
FF Website
  • Homepage
  • Search
  • Members
  • Report a Bug
Follow FF
  • Facebook
  • Twitter

FF Sister Sites:

  • Metals Mine
  • Energy EXCH
  • Crypto Craft

Forex Factory® is a brand of Fair Economy, Inc.

Terms of Service / ©2023