Hi
Ive had a few inquiries about this so I have been looking at a mechanical way of trading trends using just trend lines..
Its quite true when they say put 10 chartists in a room give them a chart ,ask them to draw trend lines and you will get 10 different answers..
This has always been way to subjective for me and so I have been looking at writing a set of rules which if adhered to will give you a mechanical foundation to draw trends execute trades and pick potentional TP and SL areas
We all know about higher highs and lower lows..Im looking more at when to draw the line .. and when to stop
Idealy the signals when they come should give a risk reward of 2:1 or 3:1 any thing else will not be entertained.
The trend lines will be drawn on an hourly chart TP and SL will be taken from the hourly chart with execution taking place on a 5 min chart.
If when I return and the tread develops I will restrict the posting to these 2 time frames alone with trend lines just on the 1 hour chart.
I have utter respect for those who draw 1 hr 4 hr daily weekly and monthly trend lines but for me its a no go area..I want my trade to be reactive to whats happened in the last hour not the last week.
I know most books look for 3 points of contact I will look for 2 but a mechanical way of doing such.
For a short TP will always be the last swing low..with my stop 2/3 as small.
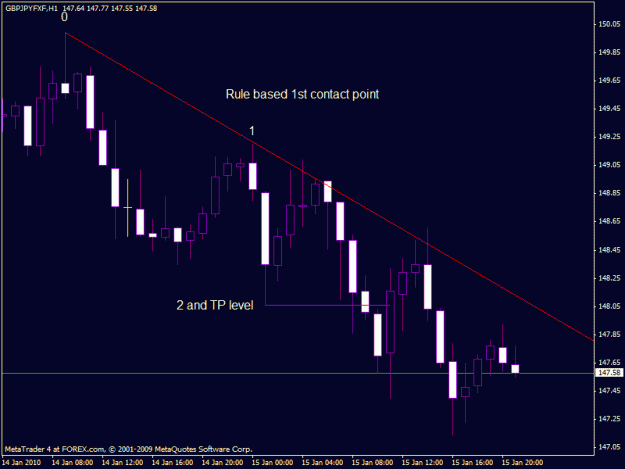
The following chart shows £yen 1 hour the 1st point of contact was done mechanicaly and rule based and is highlighted at 1..after contact at (1) I wait for the swing low (2) and a return to my trend line.
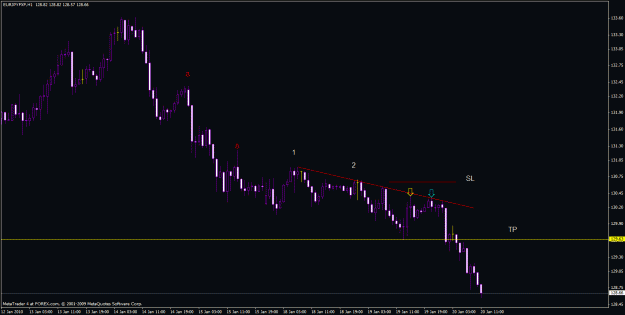
The 2nd chart now shows our 5min time frame..it shows the contact point at 1 which was marked on our 1 hour time frame and it shows our potential TP line also marked from the 1 hour time frame..and our entry at the arrow ....From this I have calculated SL and marked it on the chart.I post post rules when Im happy that its mechanical the strike rate is good and the RR is acceptable.
Point A is a 2nd short but we would of got in at the top of the peak with hardly no draw down due to rule based reasons regrading the trend line..as you can see the TP at B and the SL at C were mechanical made from the 1hour chart and was calculated on 3:1 RR
The end of this project should see a mechanical way of pulling up any 1hour chart drawing a trend line to rules and then switching to 5min for entry knowing before hand your TP and from that your SL.
Paulus


