So I turned the Detrend Price Oscillator into a histogram (for fun...I was bored in between trades today)
This is what I saw.
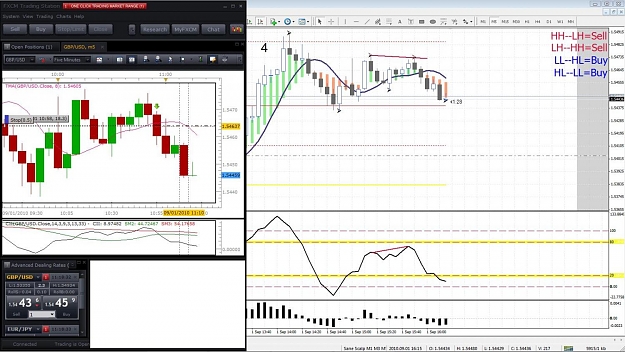
1. The histo picked up these two patterns (and CII did not)
A. The HH--LH reversal from the top down
B. The HL--LL reversal from the bottom up
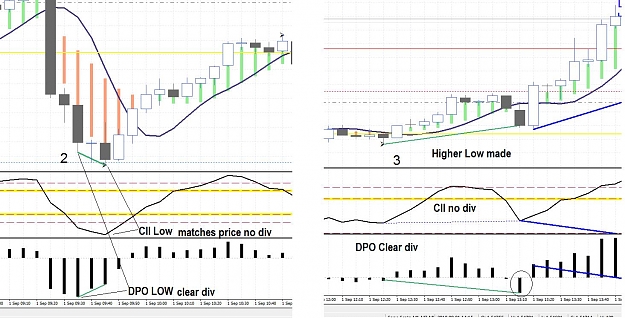
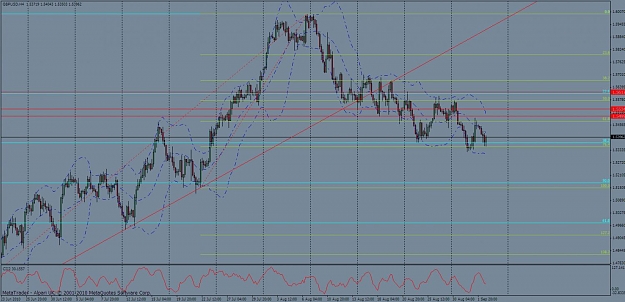
What I noticed is, 4 extra trades on todays chart using the histo bars as they show OBVIOUS divergence from the price. Here are 2 examples.
I'm thinking of using it with CII to find those specific setups mentioned above. I put notes on the attached image...pretty interesting.
This is what I saw.
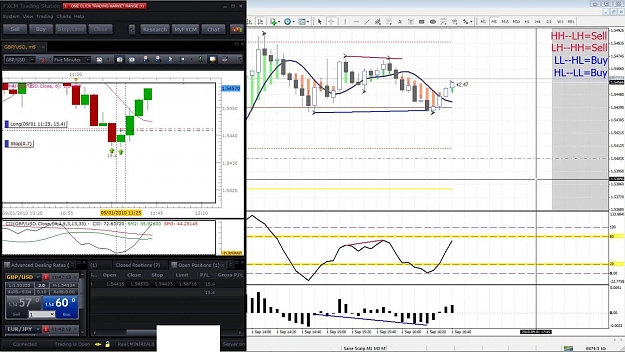
1. The histo picked up these two patterns (and CII did not)
A. The HH--LH reversal from the top down
B. The HL--LL reversal from the bottom up
What I noticed is, 4 extra trades on todays chart using the histo bars as they show OBVIOUS divergence from the price. Here are 2 examples.
I'm thinking of using it with CII to find those specific setups mentioned above. I put notes on the attached image...pretty interesting.
Attached Image (click to enlarge)