I often see people post "equity" curves from the backtester, showing only smooth lines and ignoring any drawdown between opening and closing a trade. Since Metatrader only plots a new datapoint in the equity plot when a trade is closed, you simply can not get realistic plots. Also the time is completely missing, the x axis shows the number of trades and does not draw a clear picture of the time you would have waited. In general the equity plots produced by the backtester always tend to look much nicer than they really are.
This is about to change now!
Attached is a library that will allow you to produce realistic plots of the total equity (the only important number) versus time. The plots are saved as offline charts, you can view and analyze them just like ordiary charts.
The function can also be used to create plots of manual or automated trading in real time filtered by magic number and/or comment string. Use it to monitor the individual performances of your concurrently running EAs in separate charts.
Put the library into the include folder, include it in your EA and on every tick you call the function recordEquity() with name, period and magic number. Thats all!
If you want to make a plot of closed source EAs or of your manual trading then simply create a dummy EA with recordEquity() calls for every magic number or comment string you want to record in the start() function and attach it to any chart.
If you are not a programmer then you need to find one to build this into your EA, this is a library for programmers, not an end user product!
Detailed instructions are inside the file.
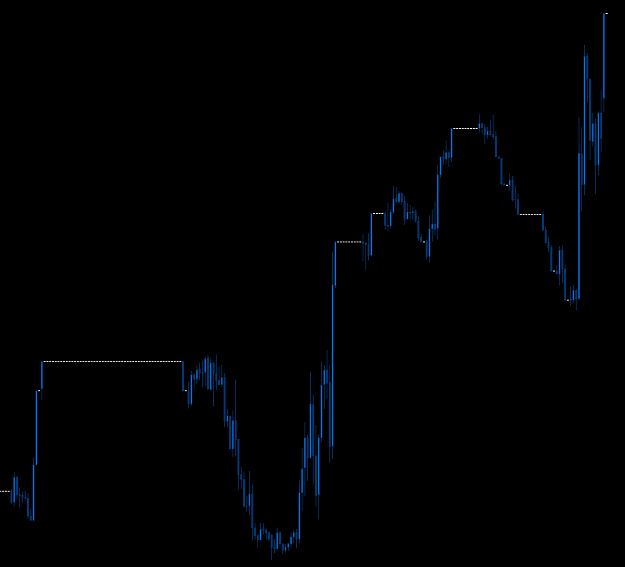
Attached is an example plot from a simple grid trading EA.
This is about to change now!
Attached is a library that will allow you to produce realistic plots of the total equity (the only important number) versus time. The plots are saved as offline charts, you can view and analyze them just like ordiary charts.
The function can also be used to create plots of manual or automated trading in real time filtered by magic number and/or comment string. Use it to monitor the individual performances of your concurrently running EAs in separate charts.
Put the library into the include folder, include it in your EA and on every tick you call the function recordEquity() with name, period and magic number. Thats all!
If you want to make a plot of closed source EAs or of your manual trading then simply create a dummy EA with recordEquity() calls for every magic number or comment string you want to record in the start() function and attach it to any chart.
If you are not a programmer then you need to find one to build this into your EA, this is a library for programmers, not an end user product!
Detailed instructions are inside the file.
Attached is an example plot from a simple grid trading EA.
Attached Image (click to enlarge)
Attached File(s)