Hi,
I have recently been looking at ways of dispensing with all indicators with a view to trading price on a short term intraday basis.
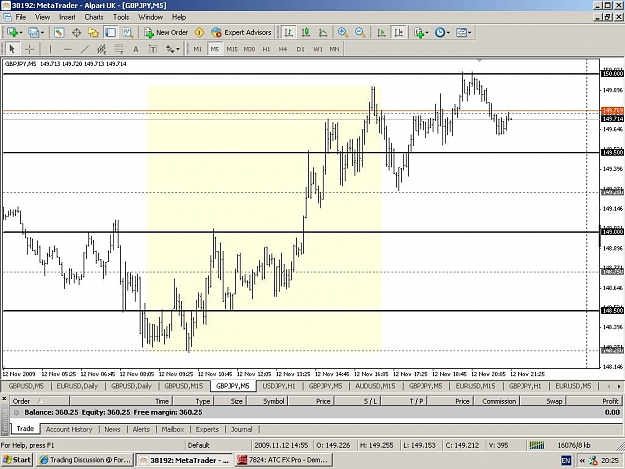
I am only looking at gbp/yen on a 5 minute time frame, no other time frame allowed, the reason for this is that the method should be able to use what is on the 5 minute chart and not have to refer to any other time frame for guidance.
I have included a chart which is today, the only things that are on it are 25,50 and 100 price lines.
The question I ask is to see if anyone can 'see' things on this chart which they would use to trade from.
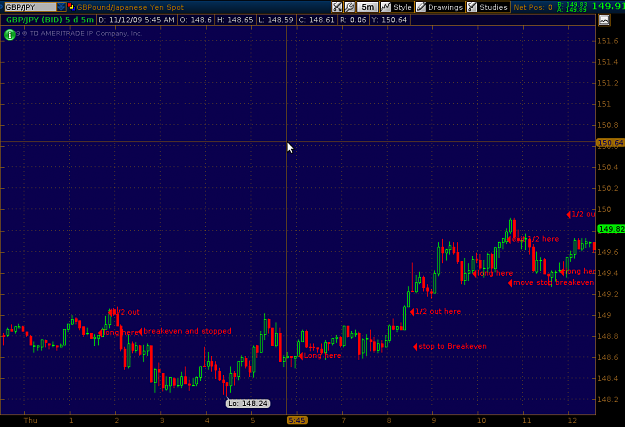
Post this exact chart with your entries and exits on and why you would have taken the trade, where your stop would be, where the problem areas are and profit etc.
If anything it may throw up some interesting insights into how different people interpet the exact same data.
If there is some interest I will post a new chart with my buys / sells on to compare with others.
I have only been looking into this in the past week and as yet it is still in development stage but no indicators are allowed!
Rules:
no indicators only price lines
trendlines allowed
only 5 minute chart
To make it easier please post charts that are the same colour as mine so the comparisons are easier to see.
Cheers J
I have recently been looking at ways of dispensing with all indicators with a view to trading price on a short term intraday basis.
I am only looking at gbp/yen on a 5 minute time frame, no other time frame allowed, the reason for this is that the method should be able to use what is on the 5 minute chart and not have to refer to any other time frame for guidance.
I have included a chart which is today, the only things that are on it are 25,50 and 100 price lines.
The question I ask is to see if anyone can 'see' things on this chart which they would use to trade from.
Post this exact chart with your entries and exits on and why you would have taken the trade, where your stop would be, where the problem areas are and profit etc.
If anything it may throw up some interesting insights into how different people interpet the exact same data.
If there is some interest I will post a new chart with my buys / sells on to compare with others.
I have only been looking into this in the past week and as yet it is still in development stage but no indicators are allowed!
Rules:
no indicators only price lines
trendlines allowed
only 5 minute chart
To make it easier please post charts that are the same colour as mine so the comparisons are easier to see.
Cheers J
Attached Image (click to enlarge)