• Home
  • Forums
  • Trades
  • News
  • Calendar
  • Market
  • Brokers
  • Login
  • Join
  • User/Email: Password:
  • 12:20pm
Menu
  • Forums
  • Trades
  • News
  • Calendar
  • Market
  • Brokers
  • Login
  • Join
  • 12:20pm
Sister Sites
  • Metals Mine
  • Energy EXCH
  • Crypto Craft

Options

Bookmark Thread

First Page First Unread Last Page Last Post

Print Thread

Similar Threads

Fractal/Swing Trading Method With Trend 7 replies

bo7a method... method for GBP/JPY 205 replies

Pipster's S\R, Trend Trading Method 14 replies

Easy trend trading method 6 replies

Jacko's P&P Trend Trading Method 73 replies

  • Trading Systems
  • /
  • Reply to Thread
  • Subscribe
  • 264
Attachments: Weekly Trend Trading Method
Exit Attachments
Tags: Weekly Trend Trading Method
Cancel

Weekly Trend Trading Method

  • Last Post
  •  
  • Page 1 23456 33
  • Page 1 234 33
  •  
  • Post #1
  • Quote
  • First Post: Edited Nov 10, 2009 10:09am Oct 23, 2009 6:52pm | Edited Nov 10, 2009 10:09am
  •  lgtj
  • Joined Mar 2009 | Status: Jesus is Lord | 637 Posts
Hello everyone. I would just like to say that I've learned so much from FF, and I'm grateful to have learned from the FF community. I work full time during the day, and I have a family also. The only time that I have to trade is when I get home from work. I've tried several short term strategies, but I wound up losing more than I made. I was determined to find a method that was profitable and that didn't require several hours in front of my computer. I developed this method based on peterM's 5/8 ma cross method and DubaiTrader's slope direction method. This is a long term trading method and was not designed for scalping. This method is still in its early stages of development so bare with me. I've done some visual backtests across several pairs with this method and was amazed at the results. The sweet thing about this method is that I only have to check my computer once a day. Ok, let's get down to business.

Pairs: Any

Time frame: Weekly/Daily

Tools:
1) rsi 8 set level to 50
2) macd (12,26,9) set level to 0
3) slope indicator set one at 15,3,0 and the other at 30,3,0
4) Ma colored indicator set to 50,0 or a 50sma set to close
5) Monthly pivot indicator (page 5 post #75)
6) Trend lines
7) 2MA crossover indicator settings: 5ema close and 8ema open. cross up symbol 233 cross down symbol 234 (modified version page 19 post 271)
8) Fractals indicator
Your weekly and daily charts should look like these:
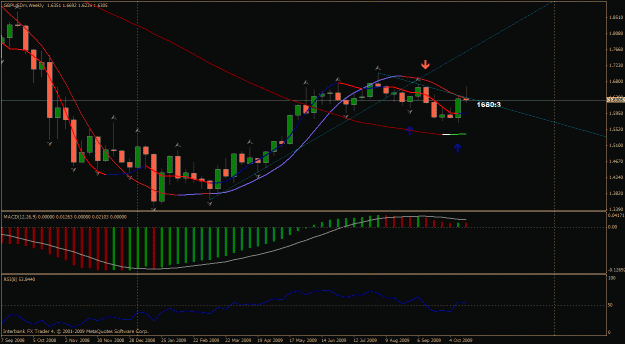
Attached Image (click to enlarge)
Click to Enlarge

Name: gbpusd weekly.gif
Size: 29 KB

Attached Image (click to enlarge)
Click to Enlarge

Name: gbpusd daily.gif
Size: 32 KB
  • Post #2
  • Quote
  • Oct 23, 2009 6:56pm Oct 23, 2009 6:56pm
  •  lgtj
  • Joined Mar 2009 | Status: Jesus is Lord | 637 Posts
Here are the indicators.

Attached File(s)
File Type: ex4 Slope Direction Line.ex4   4 KB | 2,310 downloads


Attached File(s)
File Type: mq4 2MA Crossover.mq4   7 KB | 2,252 downloads


Attached File(s)
File Type: mq4 ATM_Pure_MAColor.mq4   4 KB | 2,139 downloads


Attached File(s)
File Type: ex4 WeeklyPivot.ex4   6 KB | 1,951 downloads
 
 
  • Post #3
  • Quote
  • Oct 23, 2009 7:18pm Oct 23, 2009 7:18pm
  •  lgtj
  • Joined Mar 2009 | Status: Jesus is Lord | 637 Posts
Before we make an entry, we must get a valid signal. There are two valid signals. The first one is the conservative valid signal and the second one is the aggressive valid signal. We'll start with the conservative signal first.

Conservative Signal: 2MA cross indicator appears on the weekly or daily chart, both slope indicators must be the same color, the rsi is above/below the 50 line, and the macd signal bar is above/below the signal line. All these conditions must be met at the close of the weekly or daily candle.

Here's an example of a long conservative valid signal (red horizontal line).
Attached Image (click to enlarge)
Click to Enlarge

Name: gbpusd daily.gif
Size: 33 KB


Here's an example of a short conservative valid signal (red horizontal line).
Attached Image (click to enlarge)
Click to Enlarge

Name: usdcad daily.gif
Size: 33 KB
 
 
  • Post #4
  • Quote
  • Edited Oct 24, 2009 12:02am Oct 23, 2009 7:36pm | Edited Oct 24, 2009 12:02am
  •  lgtj
  • Joined Mar 2009 | Status: Jesus is Lord | 637 Posts
Aggressive valid signal: 2MA crossover signal appears on the daily or weekly chart, the 15 slope indicator's color is different from the 30 slope indicator's color, the rsi is above/below the 50 line, and the macd bar is above/below, close to, or touching the signal line. These condition's must be met at the close of the daily or weekly candle.

Here's an example of a long aggressive valid signal(red horizontal line).
Attached Image (click to enlarge)
Click to Enlarge

Name: gbpusd daily.gif
Size: 34 KB


Here's an example of a short aggressive valid signal(red horizontal line).
Attached Image (click to enlarge)
Click to Enlarge

Name: usdcad daily.gif
Size: 33 KB
 
 
  • Post #5
  • Quote
  • Oct 23, 2009 7:58pm Oct 23, 2009 7:58pm
  •  lgtj
  • Joined Mar 2009 | Status: Jesus is Lord | 637 Posts
The first thing to do is pull up a weekly chart(s) and place trend lines in the direction of the trend. Now check the chart for a valid signal. If one is not present, then drop down to the daily chart to see if one has appeared. If a signal is not present there either, then go to another pair.

If you have a valid signal on a weekly chart, place a buy stop at the high of that candle.

Here's an example of a long conservative valid signal on this eurjpy weekly chart(red horizontal line).
Attached Image (click to enlarge)
Click to Enlarge

Name: eurjpy weekly.gif
Size: 32 KB
 
 
  • Post #6
  • Quote
  • Oct 23, 2009 8:04pm Oct 23, 2009 8:04pm
  •  lgtj
  • Joined Mar 2009 | Status: Jesus is Lord | 637 Posts
Ok I must leave right now for family time. I'll be back later. Stay tuned.
 
 
  • Post #7
  • Quote
  • Oct 23, 2009 10:12pm Oct 23, 2009 10:12pm
  •  sunsue
  • | Joined Mar 2008 | Status: Member | 25 Posts
This combo signals some entries as good as a commercial system I've been using! Good work! Thanks, Suzanne
Mind Power Magnetizes Market Profits!
 
 
  • Post #8
  • Quote
  • Oct 23, 2009 11:39pm Oct 23, 2009 11:39pm
  •  Mrezoot
  • | Joined Jul 2009 | Status: -Eternal Student of Life- | 219 Posts
Given this system is on such large TF's ....The results might take a while to come in.... but you have my attention Mr. lgtj. Look forward to seeing all the details of this, similar to my current setup as well SunSue. Good Job!
 
 
  • Post #9
  • Quote
  • Oct 23, 2009 11:43pm Oct 23, 2009 11:43pm
  •  lgtj
  • Joined Mar 2009 | Status: Jesus is Lord | 637 Posts
Ok, I'm back. Here's another example on this usdcad daily chart of a conservative valid entry. Notice that the candle marked with the yellow line is not a valid signal because the rsi is on the 50 line and not above it. The candle marked with the red line is the valid signal candle.
Attached Image (click to enlarge)
Click to Enlarge

Name: usdcad daily.gif
Size: 32 KB
 
 
  • Post #10
  • Quote
  • Edited 9:15pm Oct 24, 2009 12:30am | Edited 9:15pm
  •  lgtj
  • Joined Mar 2009 | Status: Jesus is Lord | 637 Posts
Now for the aggressive entries, the rules are a little different. Instead of taking the entry on the chart which gave you the signal, you will drop down to the next chart to take your entry. Entries will only be taken on the 4hr, daily, or weekly charts. For the next example, I will use the audusd daily chart for the aggressive valid signal, and the 4hr chart for the aggressive entry. On the daily chart, the candle marked with the red line is the aggressive signal, and the one with the yellow line is the conservative signal. On the 4hr chart, the first red arrow is the candle that closed and completed the daily candle which gave the aggressive signal. The second red arrow is the candle that closed and completed the daily candle that gave the conservative signal. Before an entry can be taken, make sure that the conservative valid signal is already in place on the 4hr chart. If it is, place a buy stop at the high of the last candle of the daily candle. In this example it would be the candle with the first red arrow above it.
Attached Image (click to enlarge)
Click to Enlarge

Name: audusd daily.gif
Size: 31 KB

Attached Image (click to enlarge)
Click to Enlarge

Name: audusd 4hr.gif
Size: 33 KB
 
 
  • Post #11
  • Quote
  • Oct 24, 2009 12:35am Oct 24, 2009 12:35am
  •  lgtj
  • Joined Mar 2009 | Status: Jesus is Lord | 637 Posts
I gotta go to bed now. I'll be back later to explain the stop loss and exit rules. Good nite. How does this method look so far?
 
 
  • Post #12
  • Quote
  • Oct 24, 2009 12:37am Oct 24, 2009 12:37am
  •  lgtj
  • Joined Mar 2009 | Status: Jesus is Lord | 637 Posts
Quoting sunsue
Disliked
This combo signals some entries as good as a commercial system I've been using! Good work! Thanks, Suzanne
Ignored
Thanks!
 
 
  • Post #13
  • Quote
  • Oct 24, 2009 12:46am Oct 24, 2009 12:46am
  •  Ezzy
  • | Joined Oct 2008 | Status: Learning | 1,052 Posts
Hi ltgj

Looking good so far. Any profitable method is is good of course, particularly those that require less time in front of the PC.
What you do is a reflection of you....what I do is a reflection of me.
 
 
  • Post #14
  • Quote
  • Oct 24, 2009 8:40am Oct 24, 2009 8:40am
  •  lgtj
  • Joined Mar 2009 | Status: Jesus is Lord | 637 Posts
Quoting Mrezoot
Disliked
Given this system is on such large TF's ....The results might take a while to come in.... but you have my attention Mr. lgtj. Look forward to seeing all the details of this, similar to my current setup as well SunSue. Good Job!
Ignored
Hello Mrezoot. Yes the results might take a while, but the reward will be worth the wait. Remember the larger time frames are where the trends are established. If we stay with the trend we will win. Like I said in my first post, this method was not designed for scalping. I developed this method because there are a lot of us who can't sit in front of the monitor for several hours or for those who don't want to sit in front of the monitor for several hours. Because my broker is ibfx, I have to be at my computer at 8pm est to check my charts. That's it. So stick around and you'll see the power and simplicity of this method.
 
 
  • Post #15
  • Quote
  • Oct 24, 2009 8:41am Oct 24, 2009 8:41am
  •  lgtj
  • Joined Mar 2009 | Status: Jesus is Lord | 637 Posts
Quoting Ezzy
Disliked
Hi ltgj

Looking good so far. Any profitable method is is good of course, particularly those that require less time in front of the PC.
Ignored
Thanks. It gets better.
 
 
  • Post #16
  • Quote
  • Oct 24, 2009 9:15am Oct 24, 2009 9:15am
  •  lgtj
  • Joined Mar 2009 | Status: Jesus is Lord | 637 Posts
Now let's talk about stop loss. The stop loss will be totally up to you. I personally use the most recent fractal swing high/low because I want to give my trade plenty of room to breathe. Remember that your stops will be large sometimes because these trades are taken on the larger time frames. But this method was designed to get you into the market when there's volume and movement. I'll show you examples in a moment. Here are the stop loss options.

Stop loss:
1) Recent fractal swing high/low
2) Previous day's high/low
3) Above/ below nearest s&r level
4) Above/below trend line
It's totally up to you.

I'll use gbpusd daily chart for this example. The candles marked with red lines are valid signal candles. The red arrows are your stop loss options. Look at how the market moved after the valid signals were given. Price never came close to the stop loss areas. This won't be the case all of the time, but most of the time price will go in your favor without going near your stop.
Attached Image (click to enlarge)
Click to Enlarge

Name: gbpusd daily.gif
Size: 33 KB
 
 
  • Post #17
  • Quote
  • Oct 24, 2009 9:22am Oct 24, 2009 9:22am
  •  twamta
  • | Joined Mar 2009 | Status: Member | 88 Posts
First of all thanks a lot for the method. Can you quantify and tell us what kind of results should be expected? (Pips per day or per week I mean).

Thanks!
 
 
  • Post #18
  • Quote
  • Oct 24, 2009 9:54am Oct 24, 2009 9:54am
  •  trend lover
  • | Joined Oct 2009 | Status: Junior Member | 3 Posts
which one of stoploose you prefer to use
 
 
  • Post #19
  • Quote
  • Oct 24, 2009 9:54am Oct 24, 2009 9:54am
  •  yen44x
  • | Joined Dec 2006 | Status: AKA "Yen" | 1,654 Posts
I missed the purpose of the 50 SMA . . . Thanks!
Greetings from Guanajuato, Mexico
 
 
  • Post #20
  • Quote
  • Oct 24, 2009 10:05am Oct 24, 2009 10:05am
  •  lgtj
  • Joined Mar 2009 | Status: Jesus is Lord | 637 Posts
Let's talk about targets. Again it's totally up to you. Personally, my target is 1:1 RR. You could go for more, but 1:1 RR is ideal for this method. Especially, when you're trading with several pairs. I monitor 13 or 14 pairs with this method. I also use my fib tool to plot my entry, exit, and stop loss.

Fib levels and descriptions:
1) 0, ENTRY @ %$
2) .5, 50.0 @ %$
3) 1, STOP LOSS @ %$
4) -.5, 1/2 TP1
5) -1, TP1 @ %$
6) -2, TP2 @ %$

Take Profit Options:
1) 1:1 RR
2) s&r level
3) Trend line
4) Fixed target

Here's an example of the entire system at work. This chart is a long example on the gbpusd daily chart. This method gave a valid signal to go long just before the big move north. The red line is on the signal candle, and the red arrows are your target options.
Attached Image (click to enlarge)
Click to Enlarge

Name: gbpusd daily.gif
Size: 37 KB
 
 
  • Trading Systems
  • /
  • Weekly Trend Trading Method
  • Reply to Thread
    • Page 1 23456 33
    • Page 1 234 33
0 traders viewing now
  • More
Top of Page
  • Facebook
  • Twitter
About FF
  • Mission
  • Products
  • User Guide
  • Media Kit
  • Blog
  • Contact
FF Products
  • Forums
  • Trades
  • Calendar
  • News
  • Market
  • Brokers
  • Trade Explorer
FF Website
  • Homepage
  • Search
  • Members
  • Report a Bug
Follow FF
  • Facebook
  • Twitter

FF Sister Sites:

  • Metals Mine
  • Energy EXCH
  • Crypto Craft

Forex Factory® is a brand of Fair Economy, Inc.

Terms of Service / ©2023