Hello,
Place on a 15Min Chart:
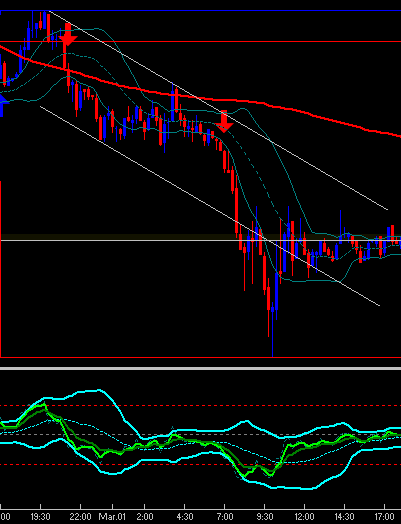
Bollinger Bands, 20SMA and 1 standard deviation
160 SMA -- used to simulate a 10 SMA on 4HR chart
RSI, 14 with BB(20, 2) And 5EMA and 8EMA
Based on the slope of the SMA draw trendlines
SHORT--
Price crosses below the Bollinger Bands near top of trend line (if showing Downtrend)
and vice versa
the RSI is used for confirmation when both EMAs cross below the middle of the bollinger
Set SL 20 to 30 pips above the upper trend line (if showing downtrend)
TP at 40, 50 or 60, let it run if its HOTTT!!!
Place on a 15Min Chart:
Bollinger Bands, 20SMA and 1 standard deviation
160 SMA -- used to simulate a 10 SMA on 4HR chart
RSI, 14 with BB(20, 2) And 5EMA and 8EMA
Based on the slope of the SMA draw trendlines
SHORT--
Price crosses below the Bollinger Bands near top of trend line (if showing Downtrend)
and vice versa
the RSI is used for confirmation when both EMAs cross below the middle of the bollinger
Set SL 20 to 30 pips above the upper trend line (if showing downtrend)
TP at 40, 50 or 60, let it run if its HOTTT!!!
Attached Image