• Home
  • Forums
  • Trades
  • News
  • Calendar
  • Market
  • Brokers
  • Login
  • Join
  • User/Email: Password:
  • 12:40pm
Menu
  • Forums
  • Trades
  • News
  • Calendar
  • Market
  • Brokers
  • Login
  • Join
  • 12:40pm
Sister Sites
  • Metals Mine
  • Energy EXCH
  • Crypto Craft

Options

Bookmark Thread

First Page First Unread Last Page Last Post

Print Thread

Similar Threads

MACD With Colored Histogram And 2 Lines 77 replies

Color MACD Histogram 29 replies

MACD Histogram 6 replies

MACD histogram 1 reply

Need help changing colors on MACD histogram 1 reply

  • Platform Tech
  • /
  • Reply to Thread
  • Subscribe
  • 4
Attachments: Anybody have Macd histogram EA ?
Exit Attachments

Anybody have Macd histogram EA ?

  • Post #1
  • Quote
  • First Post: Sep 8, 2009 9:31pm Sep 8, 2009 9:31pm
  •  market man
  • | Joined Jul 2009 | Status: Member | 15 Posts
Dear brother,

Are there anybody have EA wich trade Based on Macd histogram crossing zero line

i.e buy when histogram change from negative to positive and sell when the opposit happen .

thanks alot to all
  • Post #2
  • Quote
  • Sep 9, 2009 6:14pm Sep 9, 2009 6:14pm
  •  market man
  • | Joined Jul 2009 | Status: Member | 15 Posts

Brothers ,


i found this histogram Expert , and it seems that it have a lot of functions, but unfortunatily it did not start ( work ) with me , even no back test.


can any body kindly check it for me.


regards

Attached File
File Type: mq4 MACD Histog.mq4   15 KB | 825 downloads
 
 
  • Post #3
  • Quote
  • Sep 10, 2009 1:16pm Sep 10, 2009 1:16pm
  •  market man
  • | Joined Jul 2009 | Status: Member | 15 Posts
UP
 
 
  • Post #4
  • Quote
  • Sep 10, 2009 2:26pm Sep 10, 2009 2:26pm
  •  Ronald Raygun
  • Joined Jul 2007 | Status: 31 y/o Investor/Trader/Programmer | 5,016 Posts
MACD crossing over the 0 line is simply an MA crossover EA. Plenty of those hanging around here.
 
 
  • Post #5
  • Quote
  • Sep 11, 2009 3:24am Sep 11, 2009 3:24am
  •  market man
  • | Joined Jul 2009 | Status: Member | 15 Posts
Quoting Ronald Raygun
Disliked
MACD crossing over the 0 line is simply an MA crossover EA. Plenty of those hanging around here.
Ignored

Thanks Ronald


Unfortunatily , these are not the same.


i just insert the histogram and the moving averages lines (same setting), the crossing is not at the same time or price .


Still looking for Histogram EA.


  • Post #6
  • Quote
  • Sep 11, 2009 8:51am Sep 11, 2009 8:51am
  •  Ronald Raygun
  • Joined Jul 2007 | Status: 31 y/o Investor/Trader/Programmer | 5,016 Posts
MACD using Exponential Moving Averages if I remember properly.

Quoting market man
Disliked

Thanks Ronald


Unfortunatily , these are not the same.


i just insert the histogram and the moving averages lines (same setting), the crossing is not at the same time or price .


Still looking for Histogram EA.

Ignored
 
 
  • Post #7
  • Quote
  • Sep 11, 2009 9:50am Sep 11, 2009 9:50am
  •  market man
  • | Joined Jul 2009 | Status: Member | 15 Posts
Quoting Ronald Raygun
Disliked
MACD using Exponential Moving Averages if I remember properly.
Ignored

Thaks a gain Ronald

I just tried the Exponential Moving Averages but also it is not the same as Histogram .

regards
 
 
  • Post #8
  • Quote
  • Sep 11, 2009 10:10am Sep 11, 2009 10:10am
  •  Ronald Raygun
  • Joined Jul 2007 | Status: 31 y/o Investor/Trader/Programmer | 5,016 Posts
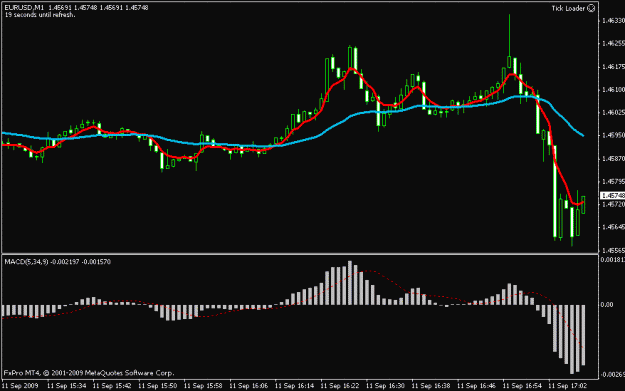
I'd have a second look at that (attached)

MA settings:
Period 5
Mode: Exponential
Price: Close

Period: 34
Mode: Exponential
Price: Close

MACD Settings:
Fast: 5
Slow: 34
Signal: 1
Price: Close

You'll notice in the picture attached that when the res line is below the blue line, the MACD is negative. When the red line is above the blue line, the MACD is positive.
Attached Image (click to enlarge)
Click to Enlarge

Name: macd.gif
Size: 20 KB
 
 
  • Post #9
  • Quote
  • Sep 11, 2009 12:08pm Sep 11, 2009 12:08pm
  •  market man
  • | Joined Jul 2009 | Status: Member | 15 Posts
Quoting Ronald Raygun
Disliked
I'd have a second look at that (attached)

MA settings:
Period 5
Mode: Exponential
Price: Close

Period: 34
Mode: Exponential
Price: Close

MACD Settings:
Fast: 5
Slow: 34
Signal: 1
Price: Close

You'll notice in the picture attached that when the res line is below the blue line, the MACD is negative. When the red line is above the blue line, the MACD is positive.
Ignored
Aha,

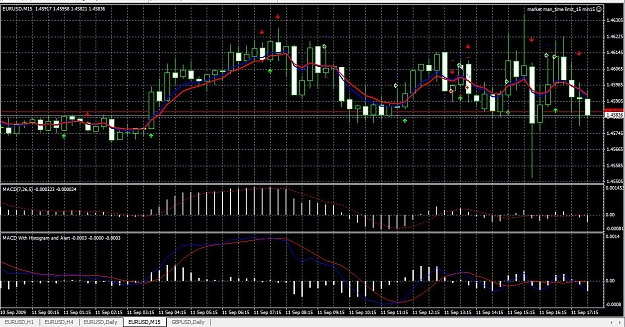
Here the miss-understand , in your attached chart the white vertical lines are not histogram but only macd, and the red dot line is the signal line. histogram arise when these ( white) line cross the signal red line.

see my attached chart you will find in the lower window the histogram and in the middle window same as yours.

Now follow in the middle window the cross between the red dot ( signal line) and the macd ( white vertical lines ) you will find when they cross they form the histogram in the lower window. and there are no relation to the EMA.
Attached Image (click to enlarge)
Click to Enlarge

Name: histogram.jpg
Size: 185 KB
 
 
  • Post #10
  • Quote
  • Sep 11, 2009 12:17pm Sep 11, 2009 12:17pm
  •  market man
  • | Joined Jul 2009 | Status: Member | 15 Posts
Ronald,

By the way i found this histogram expert.

it has alot of functions/ options , but it did not work with me

can you check it for me please

regards
Attached File
File Type: mq4 MACD Histog.mq4   15 KB | 724 downloads
 
 
  • Post #11
  • Quote
  • Dec 17, 2011 4:16am Dec 17, 2011 4:16am
  •  chandu
  • | Joined Dec 2011 | Status: Member | 2 Posts
Quoting market man
Disliked
Ronald,

By the way i found this histogram expert.

it has alot of functions/ options , but it did not work with me

can you check it for me please

regards
Ignored
I think you need imacd indicator in the expert/indicators folder.
 
 
  • Post #12
  • Quote
  • Last Post: Dec 29, 2011 3:36pm Dec 29, 2011 3:36pm
  •  ixa
  • | Joined Dec 2011 | Status: Junior Member | 1 Post
This would be a much better EA if it would close the position when the histogram makes a lower low compared to the previous tick instead of waiting for it to go below the zero line.

I played around with it with setting 5,9,3 on a daily setting and it is profitable when you look back the past one year. (Started the back-test with $1000 and half way through the year it was up $9000 only trading 0.5 lots, ended taking some loss trades around august as you know due to the crash and all and the fact that this EA goes only long)

I also found that it is not going short for me only taking long positions without placing a stop so its a bit risky when it comes to MM.

Would someone be able to either add the function so it can go short as well as long and a separate EA taking profits or losses when histogram makes a lower low or higher high if going short.

I have a few ideas for strategies if anyone would like to write them free of charge.
 
 
  • Platform Tech
  • /
  • Anybody have Macd histogram EA ?
  • Reply to Thread
0 traders viewing now
Top of Page
Forex Factory Blog Updated: Alerting All Members
  • Facebook
  • Twitter
About FF
  • Mission
  • Products
  • User Guide
  • Media Kit
  • Blog
  • Contact
FF Products
  • Forums
  • Trades
  • Calendar
  • News
  • Market
  • Brokers
  • Trade Explorer
FF Website
  • Homepage
  • Search
  • Members
  • Report a Bug
Follow FF
  • Facebook
  • Twitter

FF Sister Sites:

  • Metals Mine
  • Energy EXCH
  • Crypto Craft

Forex Factory® is a brand of Fair Economy, Inc.

Terms of Service / ©2022